The path exploration report in GA4 reveals how people move around on your site or web shop. It can also show you the sequence of actions your users take. More than often, that trip looks totally different from what you had in mind. Yet, being blind to the real user journey won’t prevent people jumping from Y to A, instead of following your ideal A to B path.
So, how can you best visualize the user journey in Google Analytics? And what can you actually do with all this data? Let’s find out…
Key Takeaways
- The ideal path on your site rarely corresponds with the path visitors actually follow.
- With the help of the path exploration report in GA4, you can find out the real sequence of visited pages and actions taken by your users.
- To prevent jumping to false conclusions, make sure you understand the three basic elements of the GA4 path report.
- This report provides answers to a lot of questions about the user journey. The 5 examples will inspire you to dive deeper.
- A reverse path analysis can be far more efficient than a traditional funnel analysis.
What is path analysis in Google Analytics, anyway?
Path analysis is a technique to see the sequence of web pages users visited as well as the actions they took on these pages. You can do this analysis in GA4 with the path exploration report.
A report looks as follows:
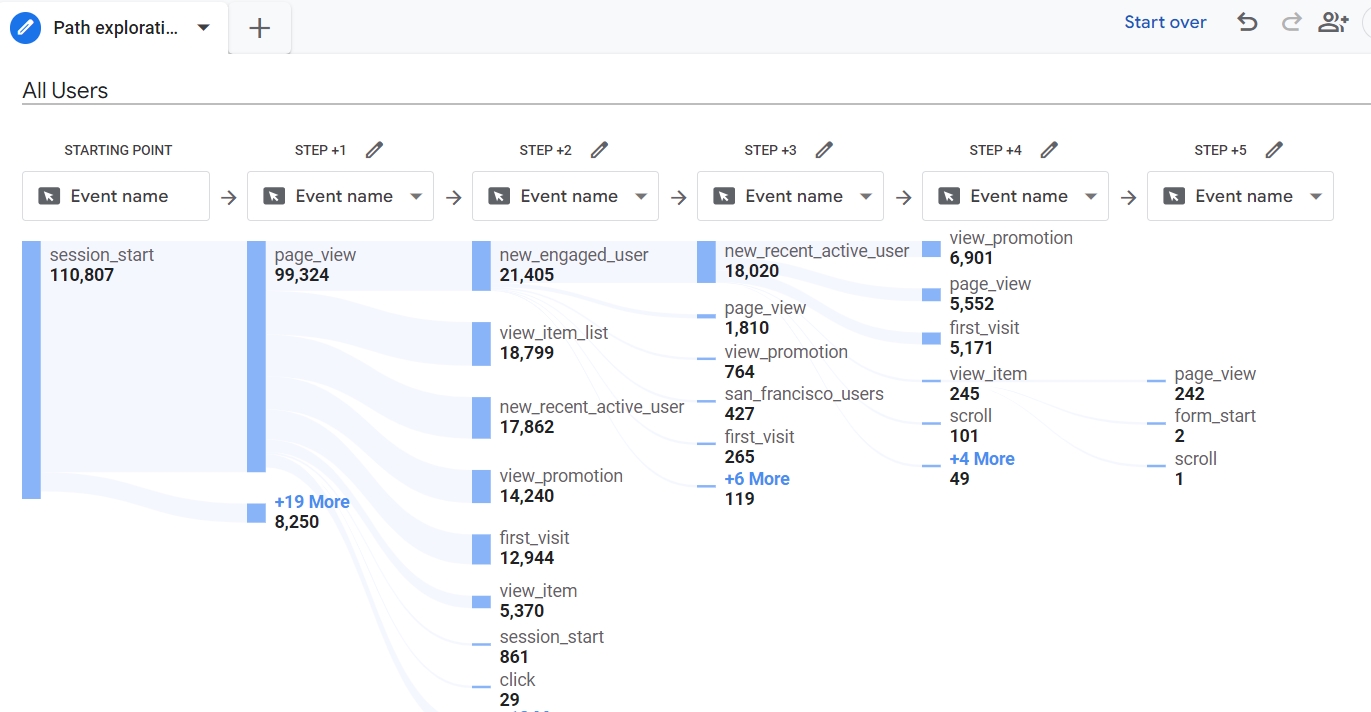
And that is probably more complex than the simple path you, your web designer, or your marketing team had in mind.
I am not saying that simple flows like these are a waste of time:
- Visit home page -> visit product page -> add the product to the cart -> checkout.
- Visit a blog post -> subscribe to newsletter.
But people have their own will. Also, malfunctioning software can disrupt the flow you had in mind. A button, for example, may prevent users from proceeding their journey.
Jeff Sauer, the founder of Data Driven U, once summarized it as follows:
The web is many things, but linear is not one of them
And in the rare cases it is linear, your visitors may still go in another direction than you had hoped for.

A lot changed since Jeff posted his concerns about visitor pathway analysis..
GA4, for instance, has now a built-in path exploration report and it makes path analysis easier than ever before.
Where is the path exploration report in GA4?
To open the default path exploration in GA4, follow these steps:
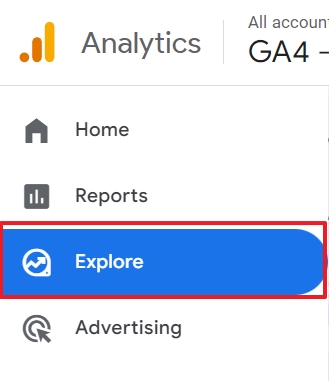
- Click Explore in the left navigation.
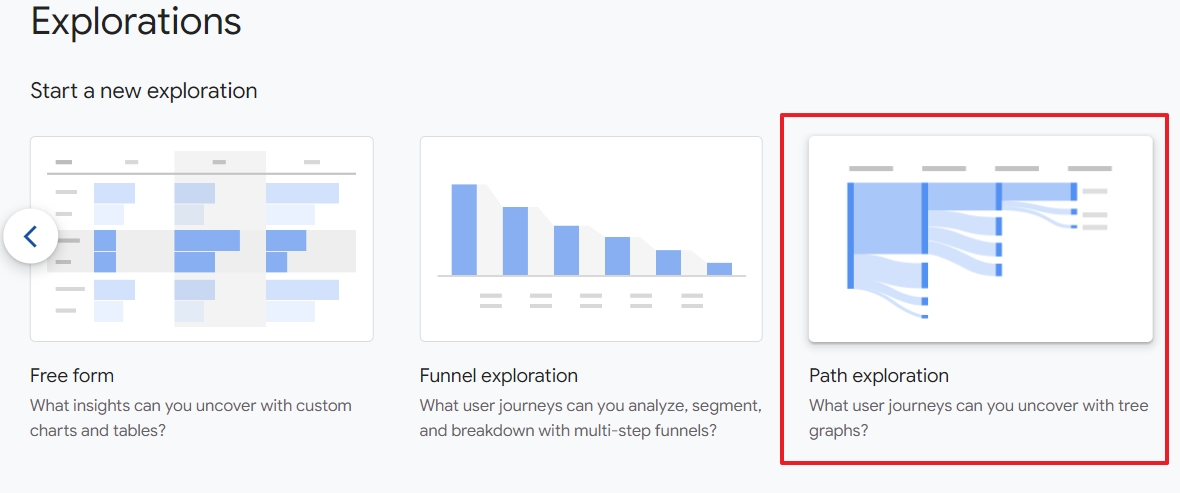
- Click Path Exploration.
- A default Path Exploration opens with some data that probably doesn’t help you a lot.
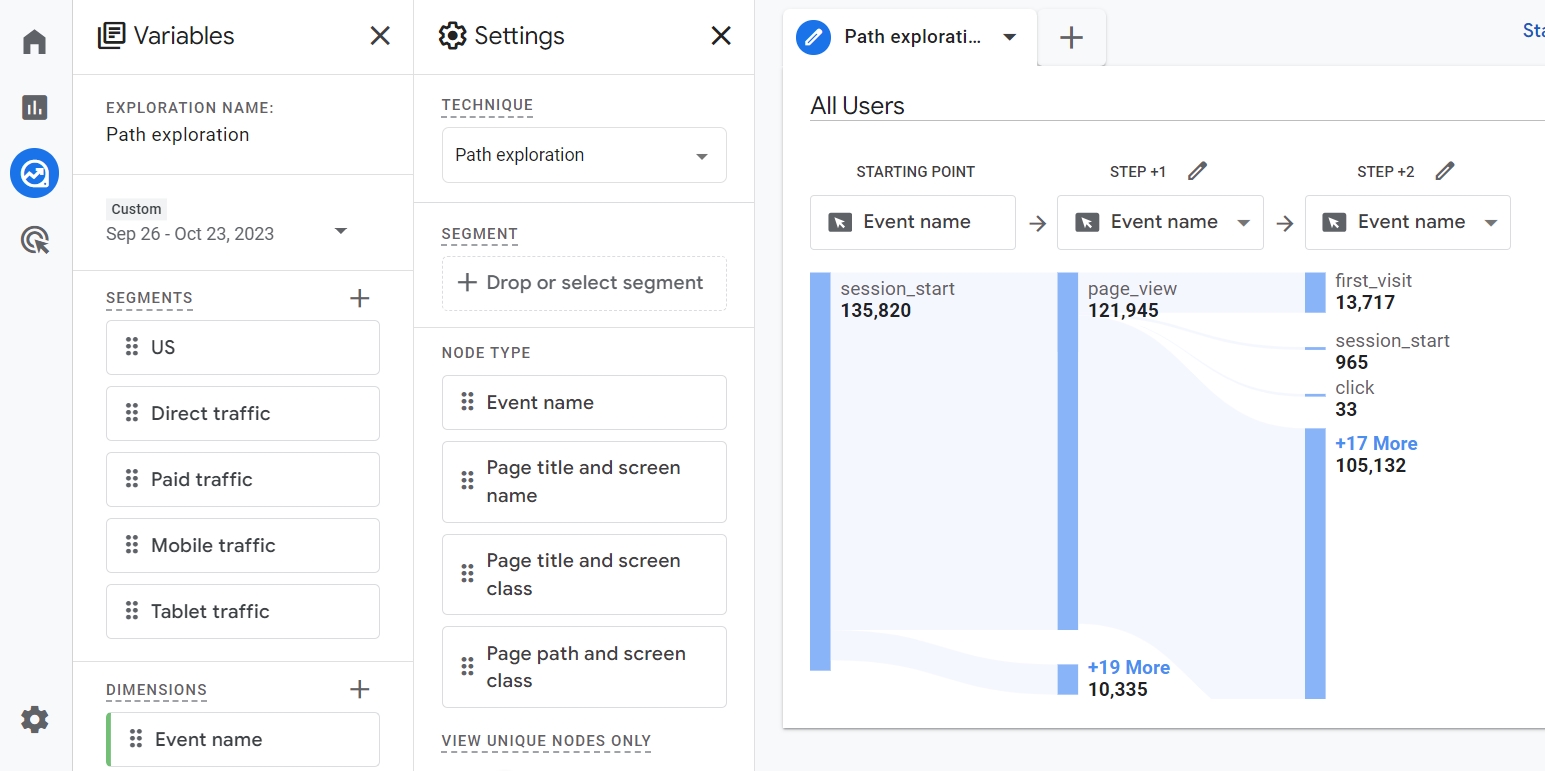
If this is the first time you open a GA4 exploration report, I feel your pain.
I really do.
The following is not based on a survey, but my best guess is that everyone who entered the world of GA4 followed a path from WTF to FTW.
Mine looked like this:
- WTF am I looking at? (first glance at a GA4 exploration)
- What the heck are those two vertical bars with Variables and Settings? (30 seconds after the first shock)
- How on earth can this report give me any insights about the user path?
- Hm, maybe I can get this to work? (the staring changes into clicking around)
- FTW: oh cool, that is a handy report. (let me write a post about the path exploration report and share it with our community of data-driven marketers)
In the remainder of this article, I want to spare you from WTF moments and let you immediately start with a FTW.
But what exactly are the wins of using path exploration reports?
The purpose of the path exploration report
The GA4 path exploration report is a powerful tool to reveal insights about the user path on your site.
On a more practical level, this report can answer a ton of questions, such as:
- Which pages do people visit after they land on your home page?
- What actions do users take after something goes wrong?
- Do people jump back to a previous page because they get stuck?
- What happens usually when users have done a sequence of things on your site?
- What did visitors do right before they converted, or bought a product?
- Etc.
Now you have a better idea about what the path report can reveal, let’s dissect it.
Understanding the path exploration report
If you like rolling up your sleeves and getting into action, you can skip this section and move to the next one. It contains real-life examples and step-by-step instructions on how to customize the path exploration report.
The 3 main elements
The path exploration report contains 3 main elements: the variables panel, the settings panel, and the tree graph.
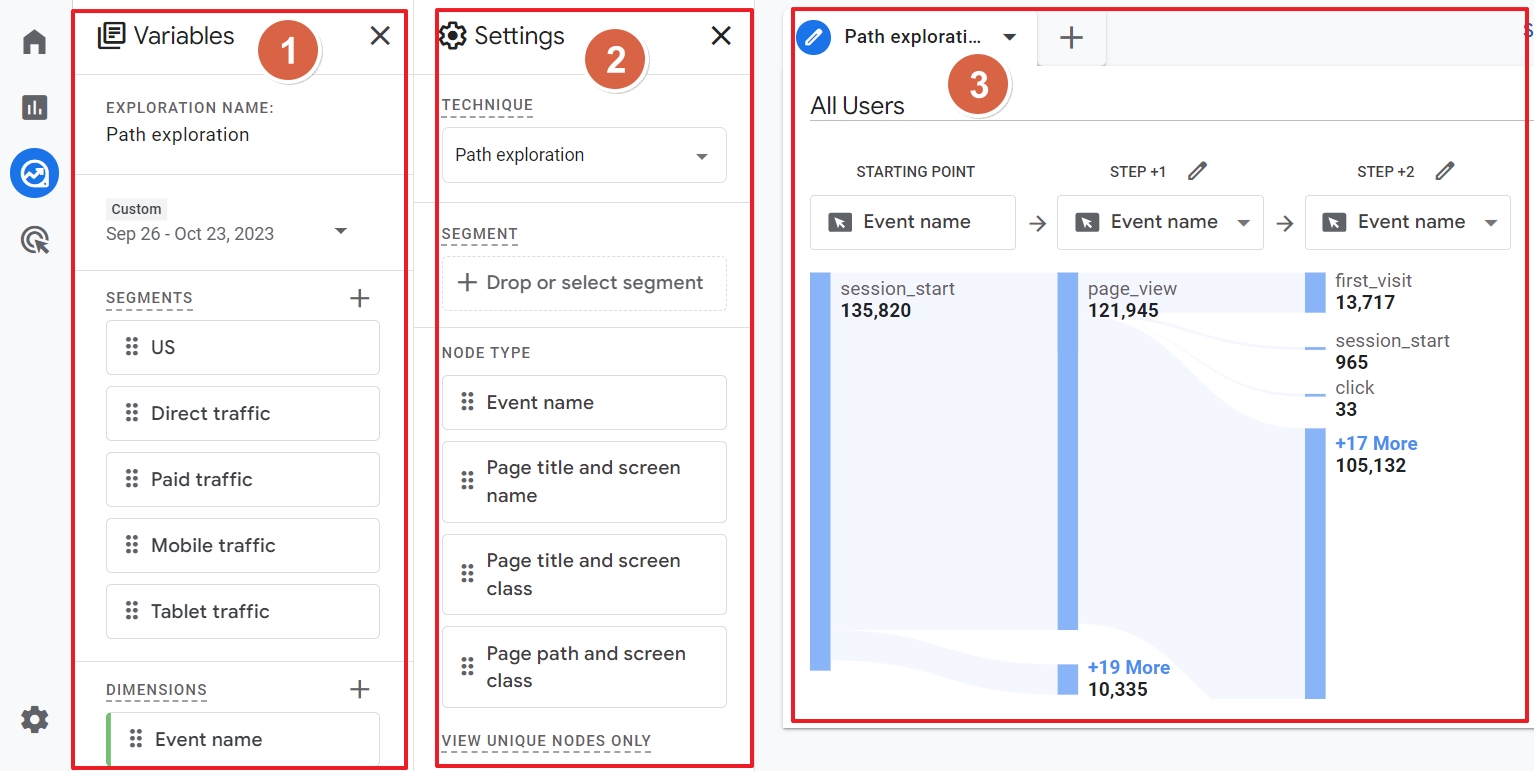
Once you understand what these building blocks are meant for, you will be able to generate other exploration reports faster. All of a sudden, creating an exit report, for instance, will feel like a game instead of a struggle.
1. The variable panel
In the variable panel, you can add, change or remove some items of your report.
For path reports, two items are of particular importance.
Date range: multi-session visit
What’s really interesting here is that GA4 can show the path of users across different sessions.
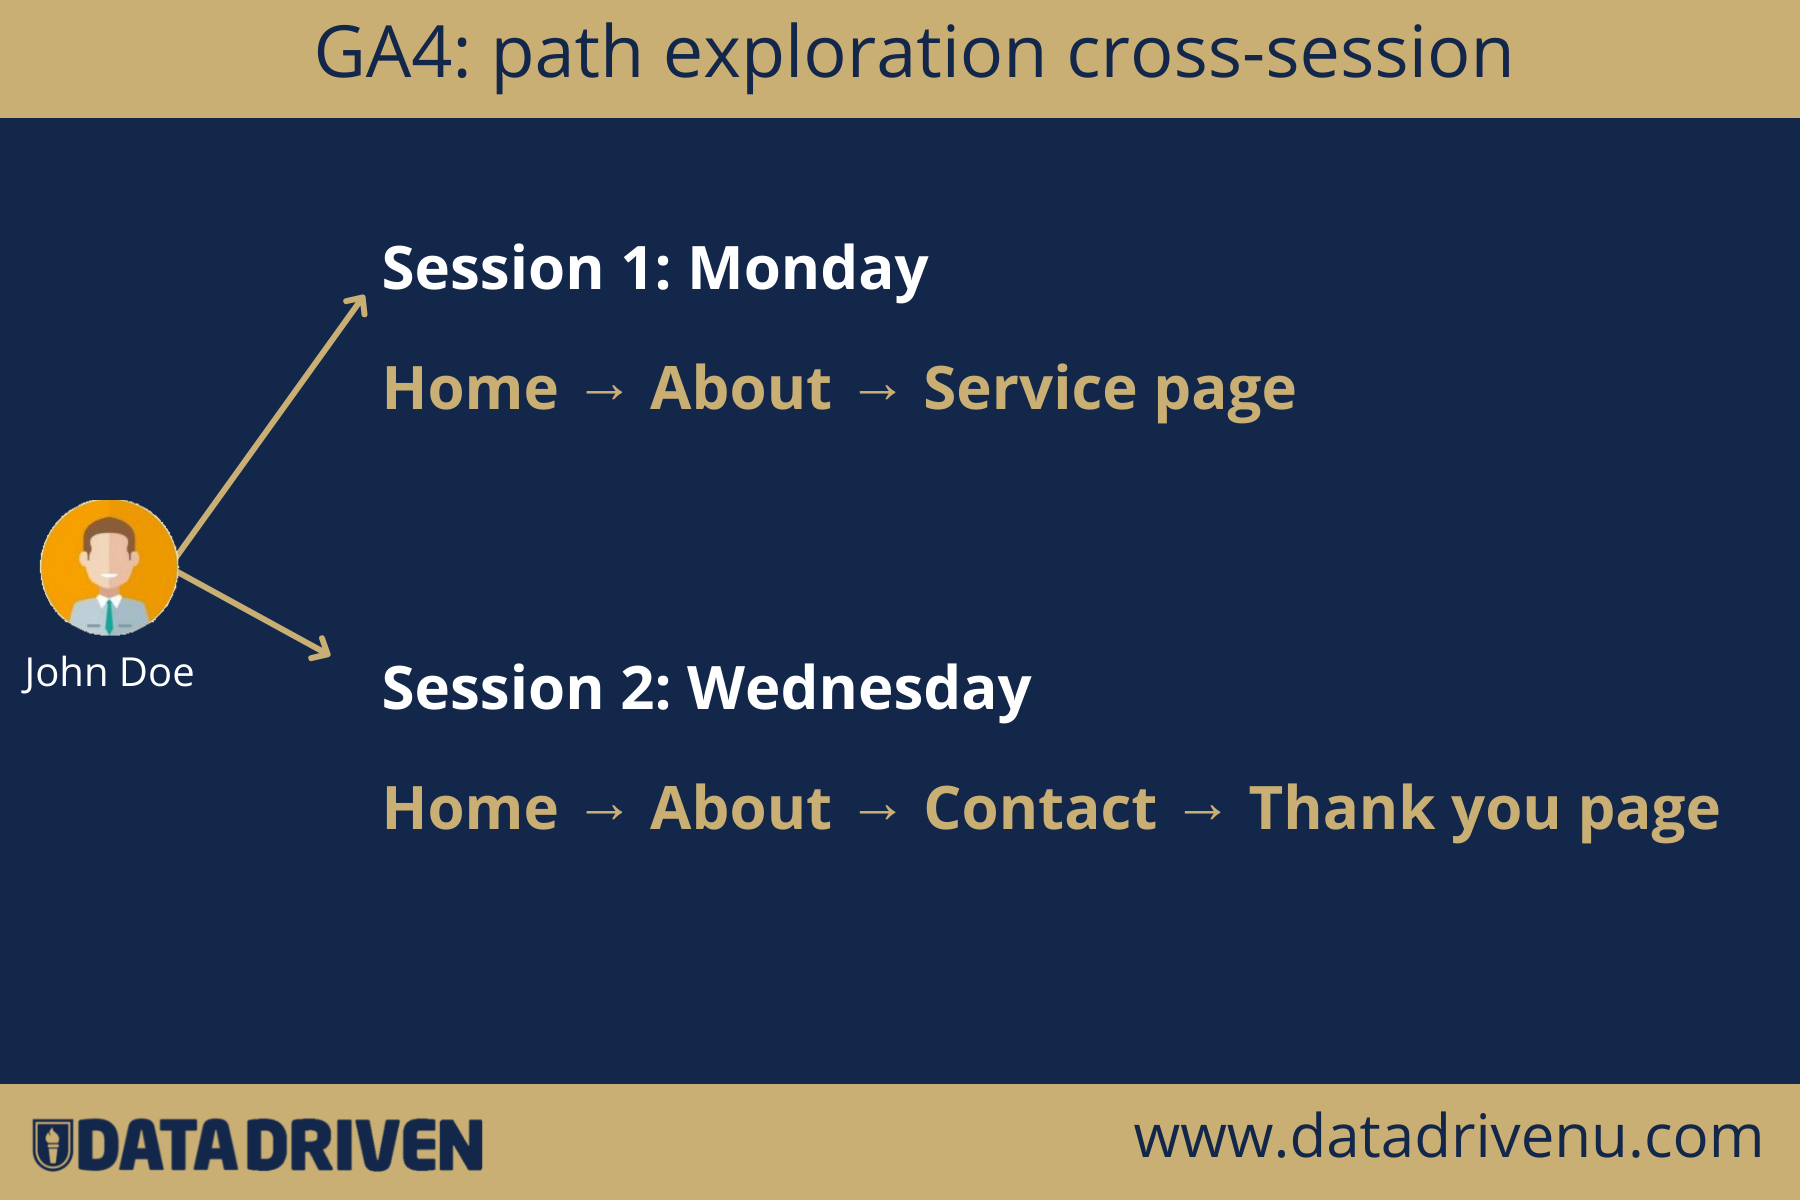
Let’s look at a possible stream of a visitor with a 100% pure randomly picked name, John Doe.
Session 1, Monday
-> John visited your homepage.
-> Then he visited your about page.
-> Then he looked at your service page.
Session 2, Wednesday
John comes back to your site and continues his journey. This time, the stream looks like this:
Home page -> About page (again) -> Contact page where he fills in a form -> He lands automatically on a thank you page.
The same user, different sessions. Here is a visual presentation:
The logical question is then: how does GA4 show these sessions in the path exploration report?
Well, that depends on the date range you select.
In the image below, you can see the path for one user and two sessions.
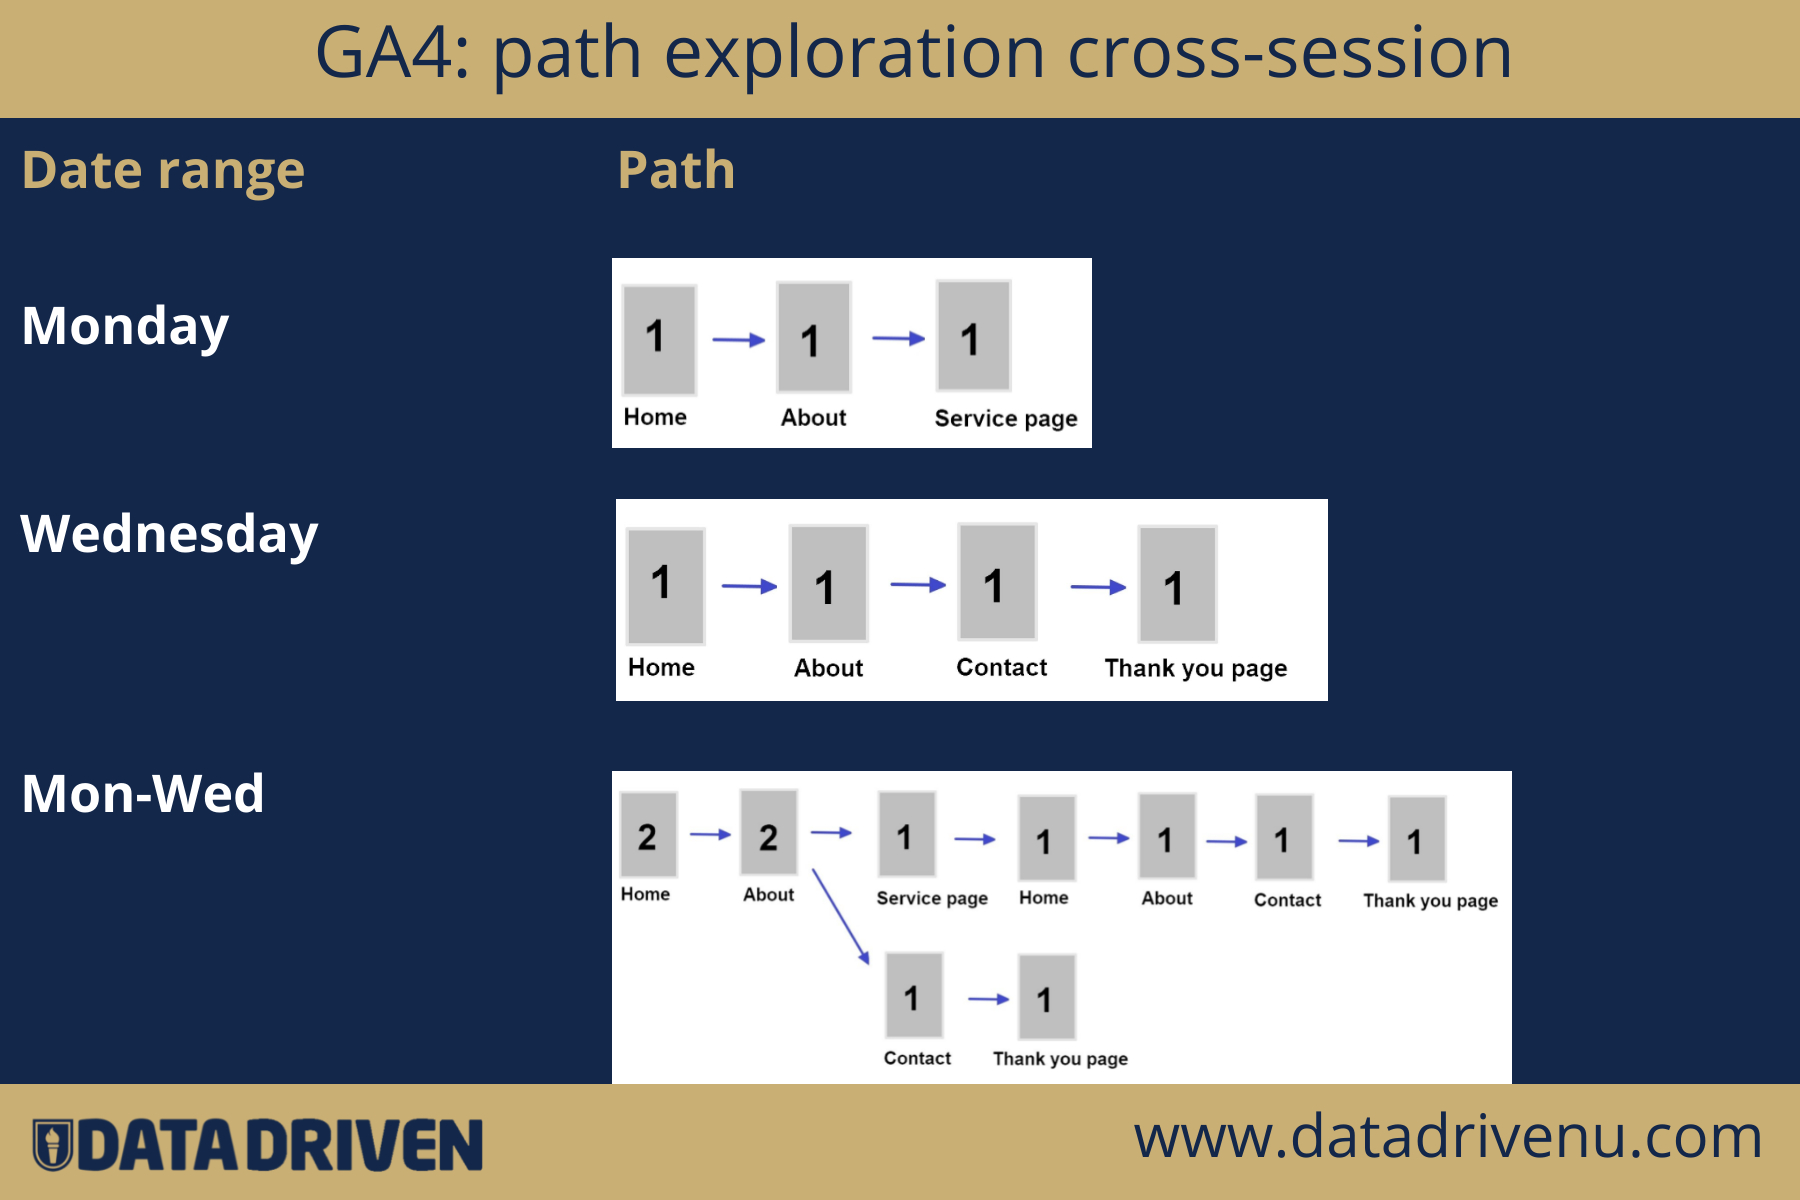
You may have wondered what the 1 and 2 refer to in this path. Let’s find out.
Path exploration metrics
Currently, you can use two metrics in the path exploration report: event count and total users.
You can easily change the metrics of your report by dragging the metrics from the Variable panel to the values field in the Settings panel.
Don’t try to untangle that description, the following screenshot explains it better.
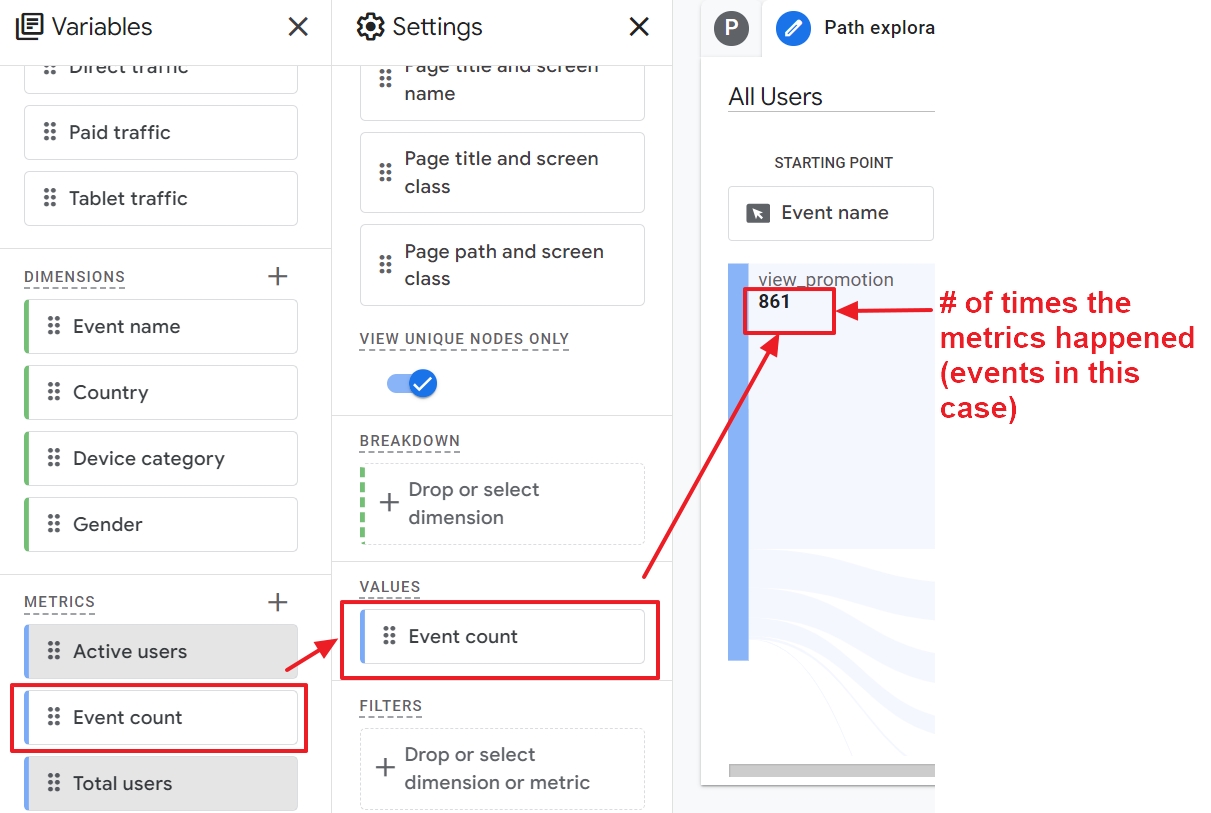
To keep things simple:
- If you want to see how many visitors were on your Home page, use the Total Users metrics.
- If you want to find out how many times your Home page was visited, use the Event count metrics.
Further below in the examples, I will illustrate the use of Segments and Dimensions in the path report.
Let’s move to the second element.
2. Path exploration settings panel
The Settings panel consists of three elements that are worth explaining.
Exploration technique
Here you need to make sure you have selected Path Exploration as the technique applied to the report.

You can change the technique, but it is likely your report will break up. Not all explorations can use the same metrics, segments and dimensions.
Node type exploration path
The Settings panel has 4 different nodes: Event name, Page title and screen name, Page title and screen class, Page path and screen class.
At this point, the differences between Page nodes are not important, so I refer to our article that explains everything about pages and screens.
It is, however, important to know you can change the node types in the third element of the exploration, as you can see in the screenshot below.
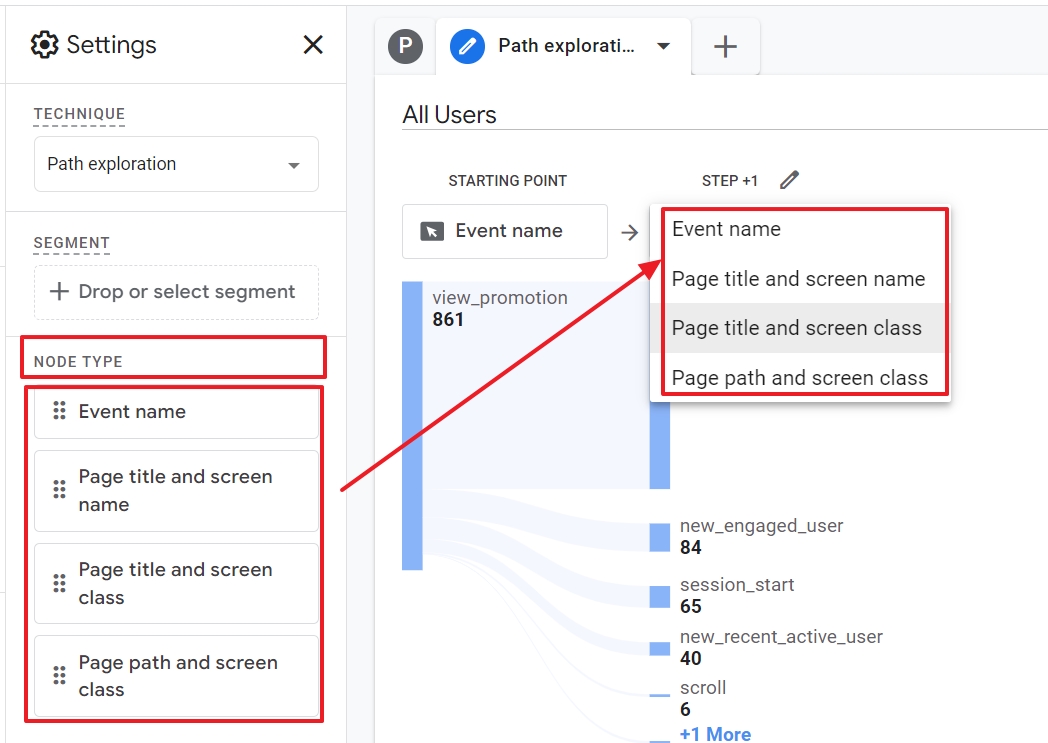
It is useful to understand what a node is in the context of the path exploration report.
Google defines it as follows:
Nodes are the data points within steps, representing the number of users or events at that point in the path.
Put differently: you can either see
- which pages someone visited (all the Page nodes)
- or which actions users took (events). Think, for instance, of downloading a file, clicking a link, scrolling, adding a product to the shopping cart, etc.
Unique nodes
Right below the nodes, you can switch the View unique nodes only setting on or off.
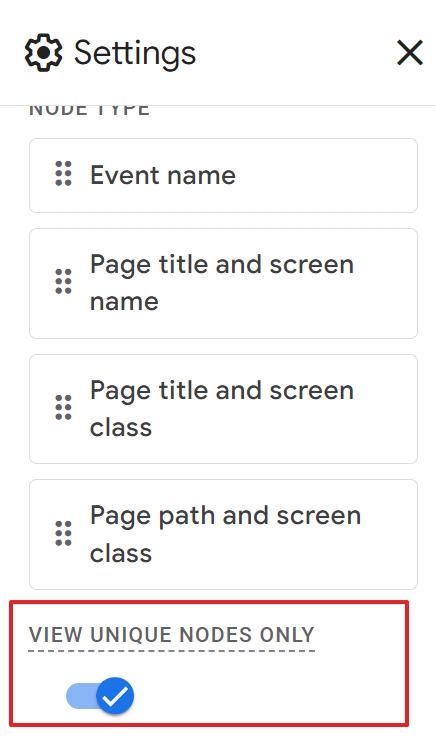
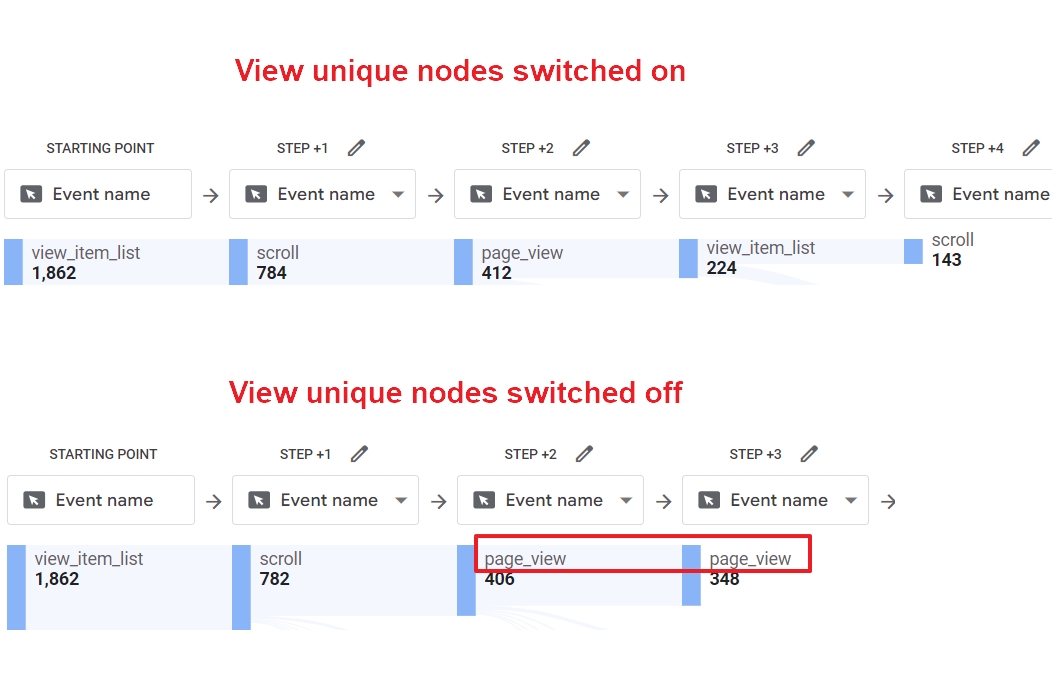
When switched on, the report doesn’t repeat the same node types that happen directly after one another. In the screenshot below, for example, you can see that page_view only occurs twice in step +3 of the path. This is because the unique node view setting is switched off.
And that brings us to the last element: the tree graph.
3. The path tree graph
Let’s start again from the sample path exploration report. When you open it, you see something like this:
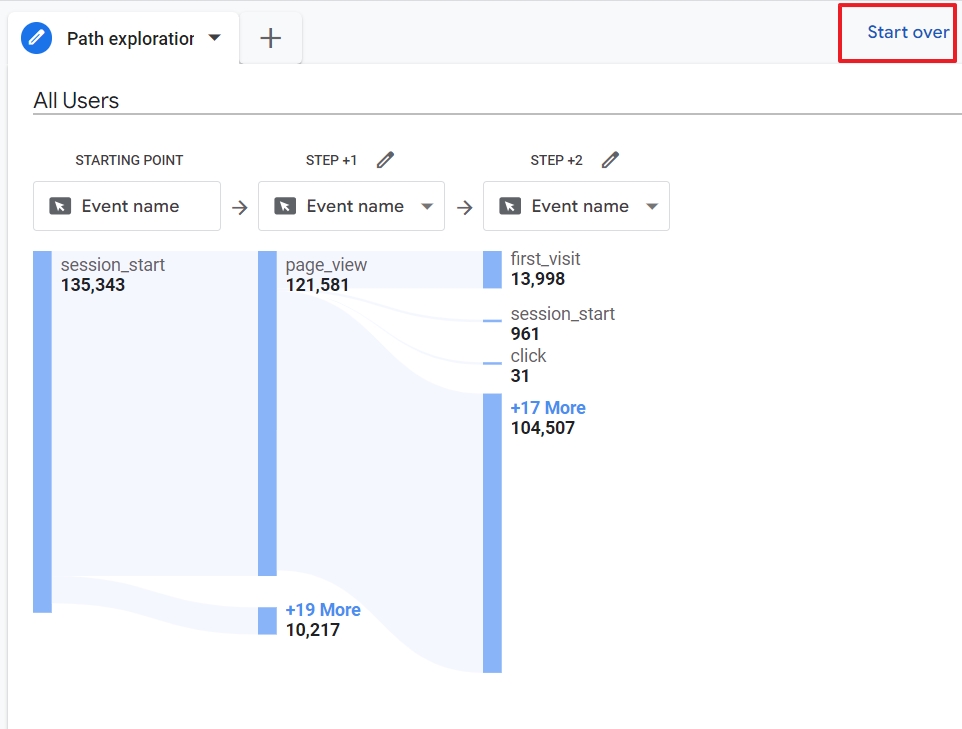
This will probably not be useful to you, or too confusing.
Just click Start Over in the right-top corner to build a path report from scratch.
Now you have two options: choose a starting or ending point for your path analysis.

Please note:
You can only choose the starting point or ending point for your path analysis.
Starting point of the path
I already explained what nodes are, but here is a summary: either you analyze an action on your webpages (e.g. add something to the shopping cart) or a page or screen view.
Ending point of the path
If you choose an ending point for your path analysis, your tree graph will start from the right. The previous step will be called Step -1.
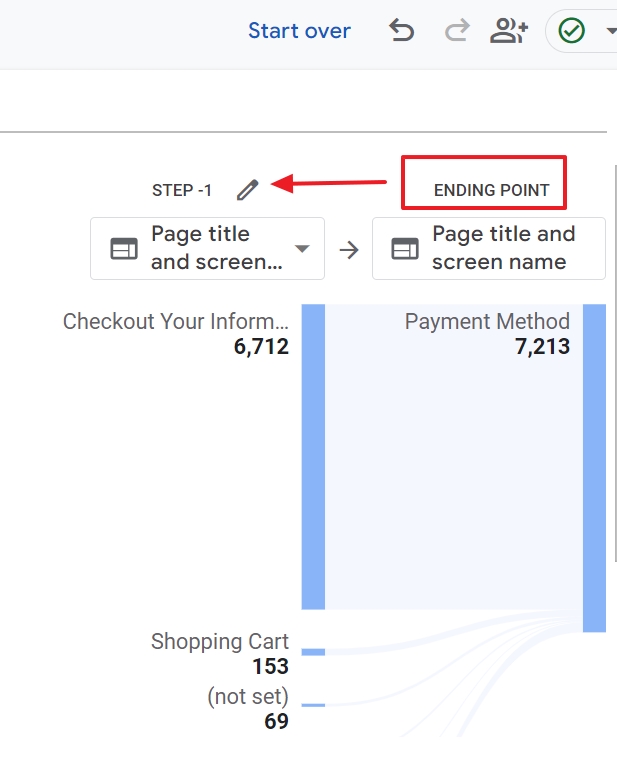
Steps of the visitor’s path
The moment you have chosen a starting or ending point, the following, or previous step in the case of a reverse path analysis, automatically appears in your tree graph.
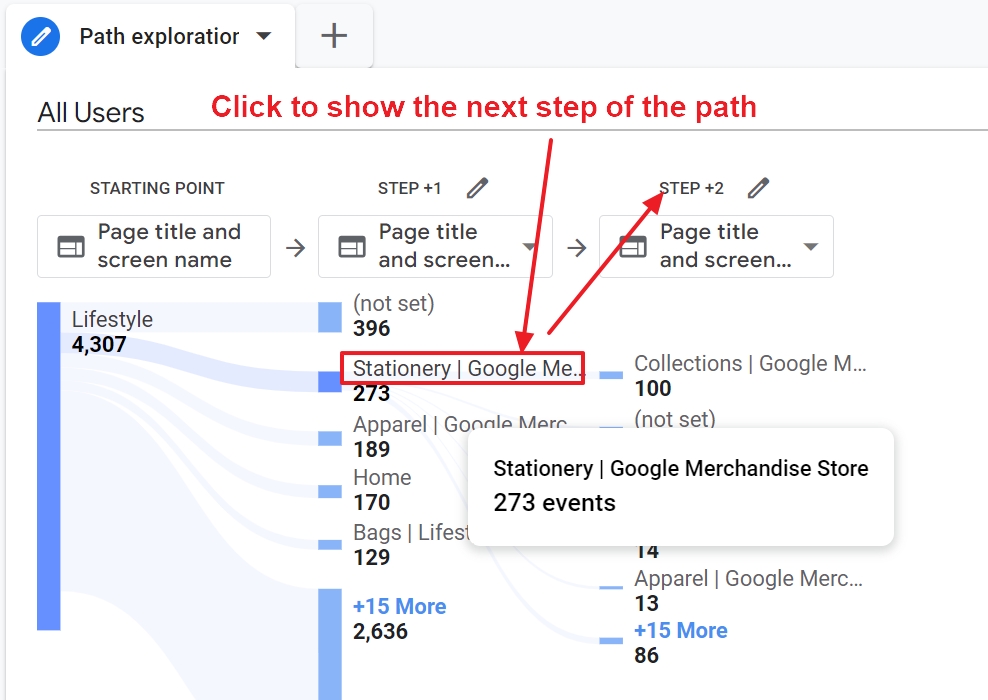
These are the basic elements of the report.
Follow me on a deeper journey with some examples of path reports.
5 practical examples of path explorations in GA4
Real-life examples are a good way to illustrate how powerful path analysis reports are.
An even better way is to ask questions and then look at how this exploration report can provide you with answers.
You can create path reports by either starting from scratch, or you can change an existing one.
I will kick off with an existing report. It’s a good opportunity to show you some additional cool things you can apply to your own path reports.
Which pages do people view most after visiting your homepage?
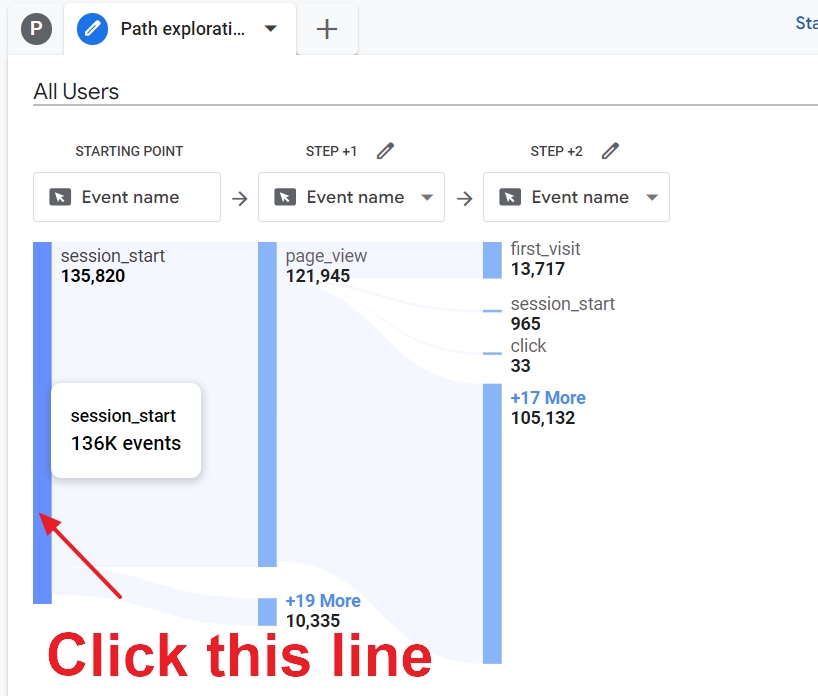
To answer this question, you open the Exploration Report in GA4. It has data in it, but that’s fine.
- Click on the blue line of the Starting Point column
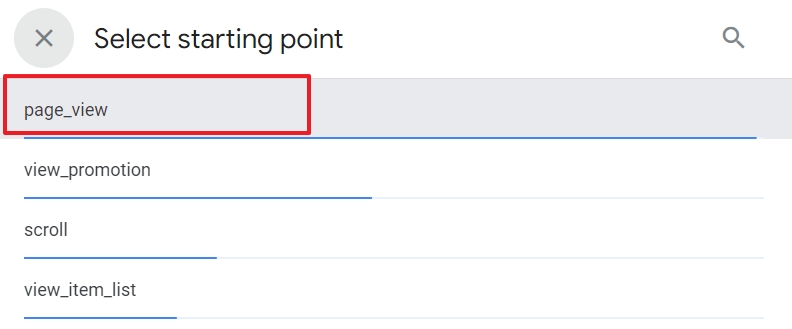
- Click page_view to make that event as the Starting point of your path exploration
- Click Event name in the Step 1 column.
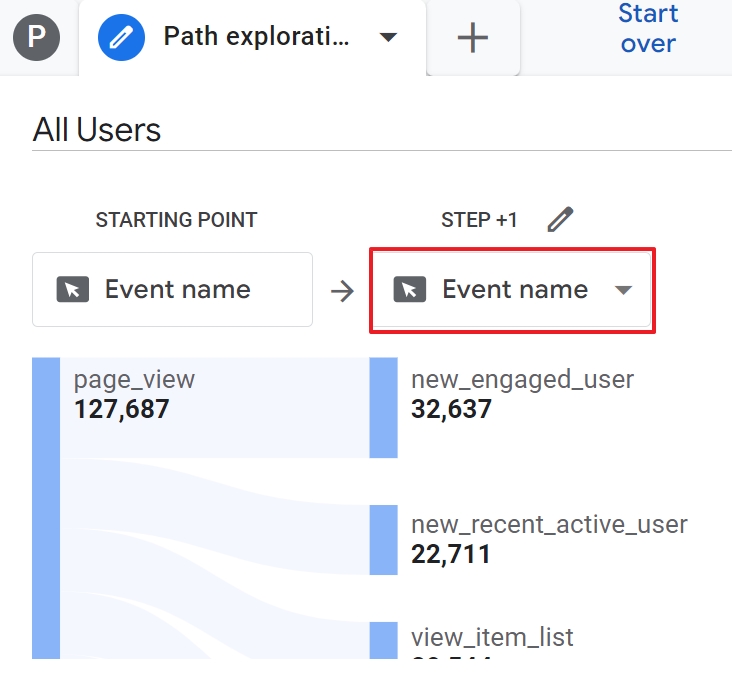
- Choose Page title and screen name. Then, check if you see your homepage appear in the tree graph.
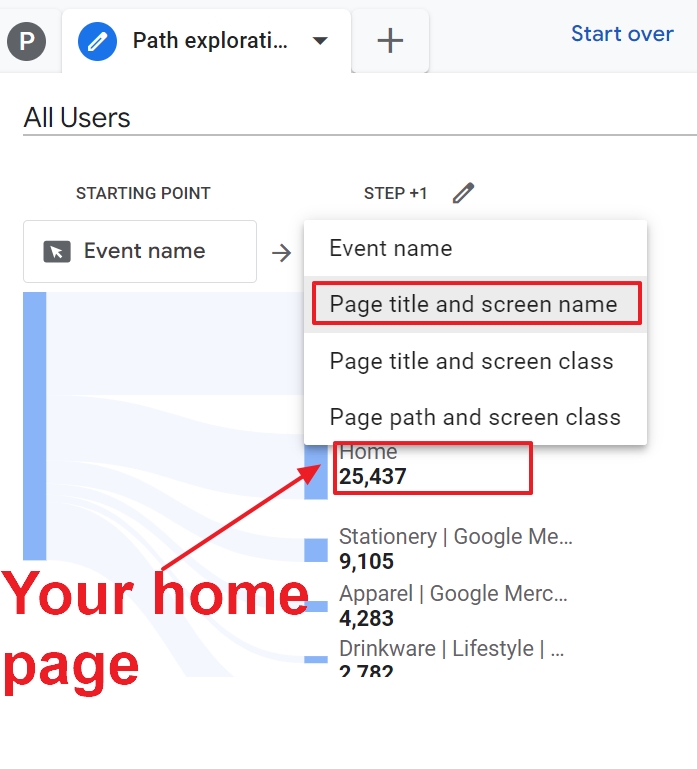
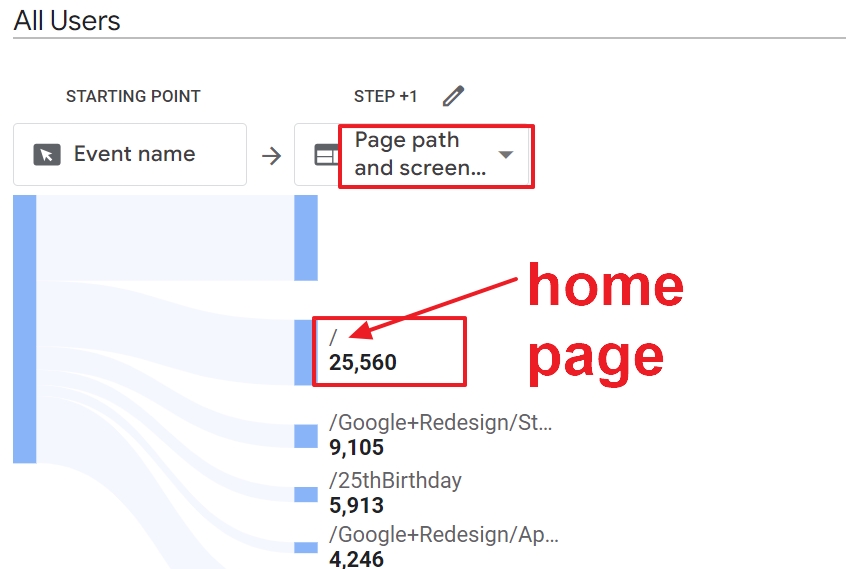
If you don’t see “Home”, that can mean two things:
- Nobody visited your home page in the selected period.
- Your home page has another title than “Home”. In that case, select Page path and screen class and then look for a backslash in the graph. That is your home page.
- Click on your Home page in Step+1. GA4 now shows Step+2 with a column of all the sequential pages users visited right after your homepage.
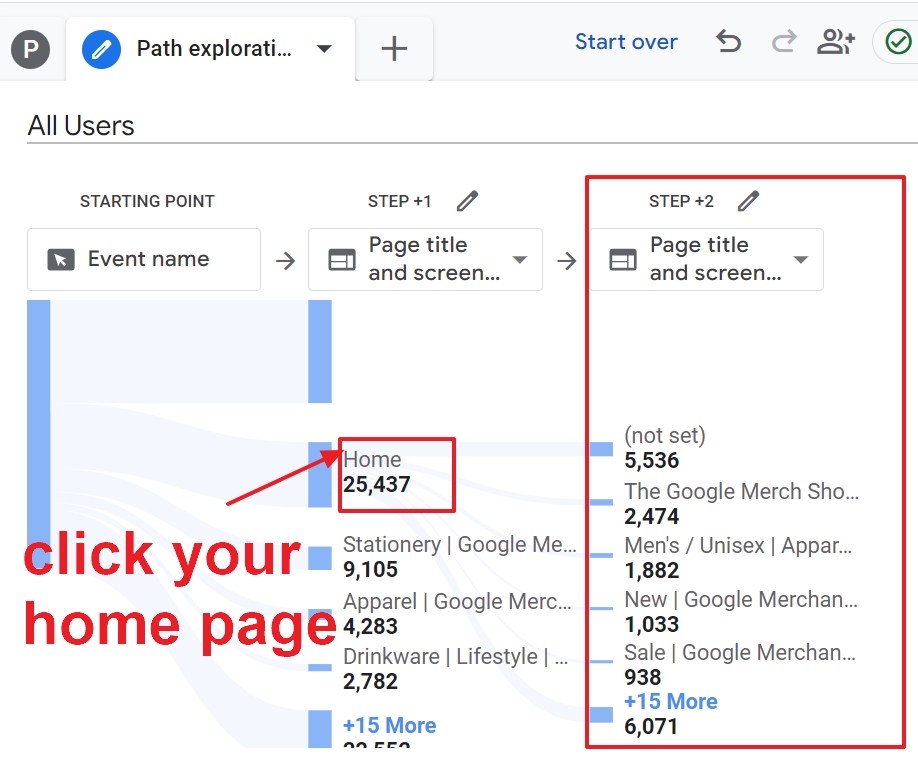
In this step, you can see how many users in total visited which pages.
If you change the metrics in the Settings panel to Event count, you can see how many times the homepage was visited.
If you click on “More” in the Step+2 column, you can expand the list of visited pages.
It can quickly get messy, especially if you have a site with many pages. Read on to find out how you can fix this problem.
Which pages do users visit after viewing a particular page of my site?
I continue with where we left off in the previous question. We just set up an exploration to see the pages visited after the home page.
As you can see, a lot of pages can be “not set” and that sucks. But you can filter these (or any other pages) out as follows.
Click on the Pencil icon of a Step in the path.
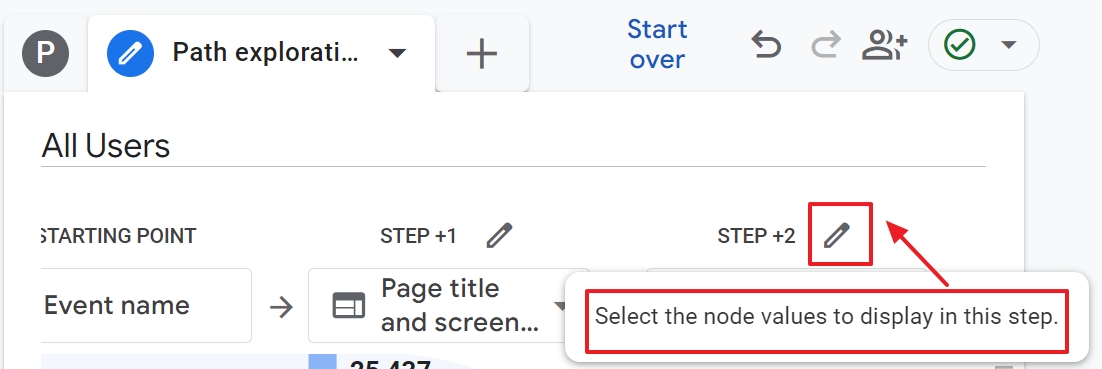
Now you can select the Homepage, or any other page you want to include in the tree graph of your path analysis report.
Then click the blue Apply button.
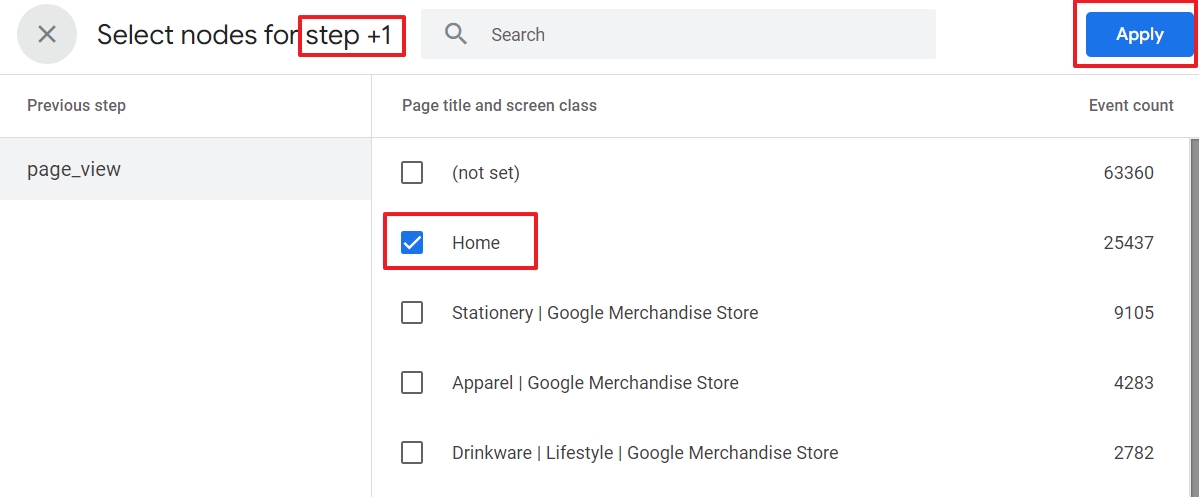
You can apply this kind of filter on any of your steps.
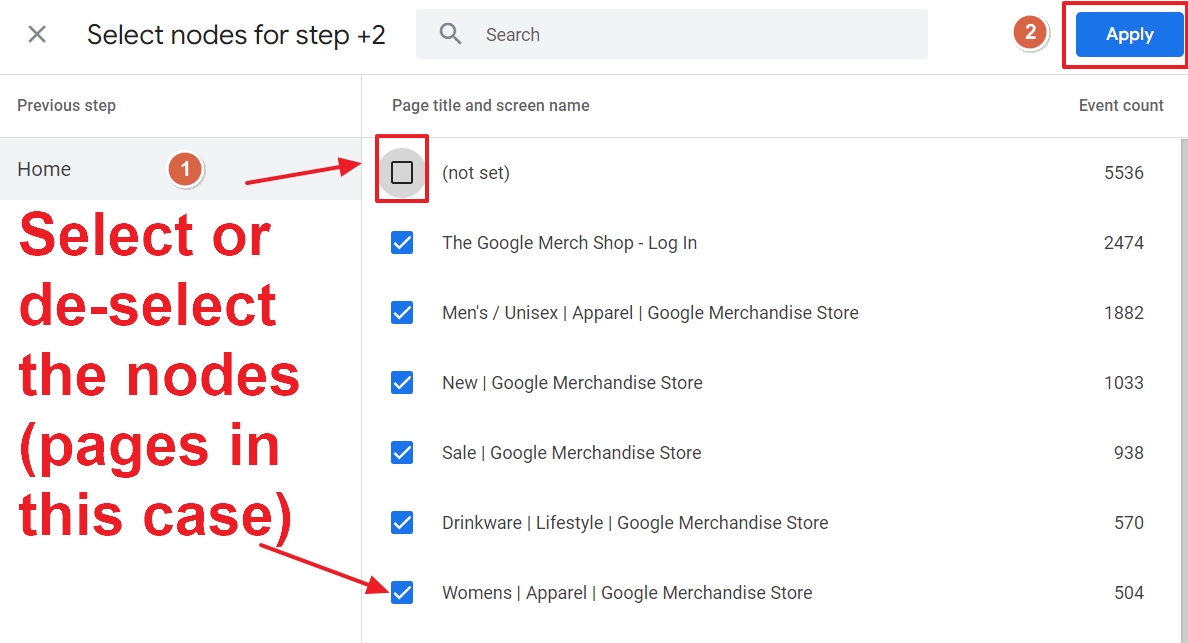
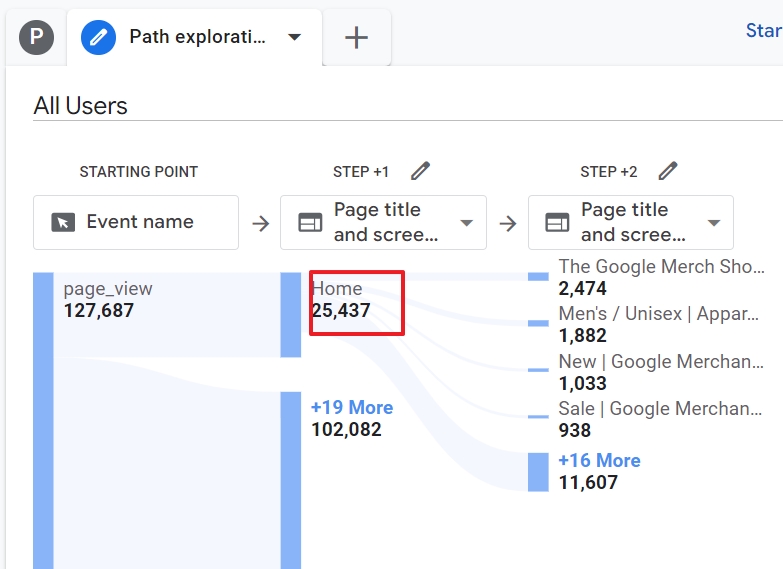
This report looks much cleaner than the first one.
It only contains the home page as Step+1 and the Not set pages are filtered out from Step+2.
On which page do visitors return most to your homepage?
That’s an interesting question, because if one page pops out, it may indicate that visitors feel lost on that particular page.
To find the answer, you do the following in your path exploration report.
Click Start Over and then choose the Page title and screen name as Starting point.
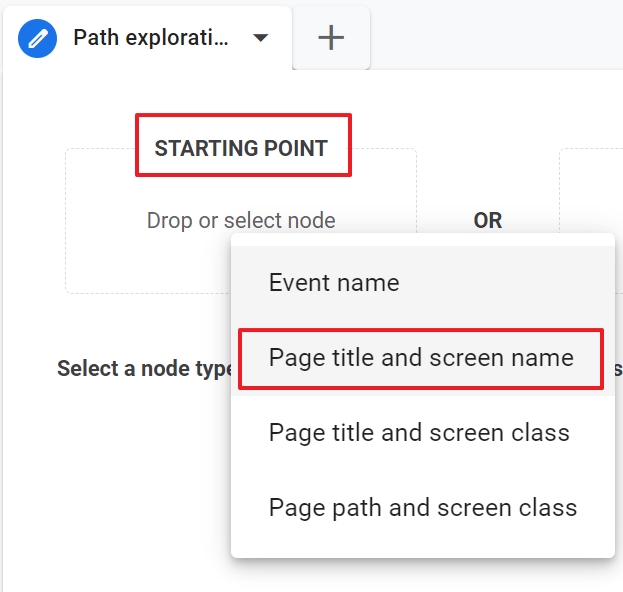
Then you click Home.
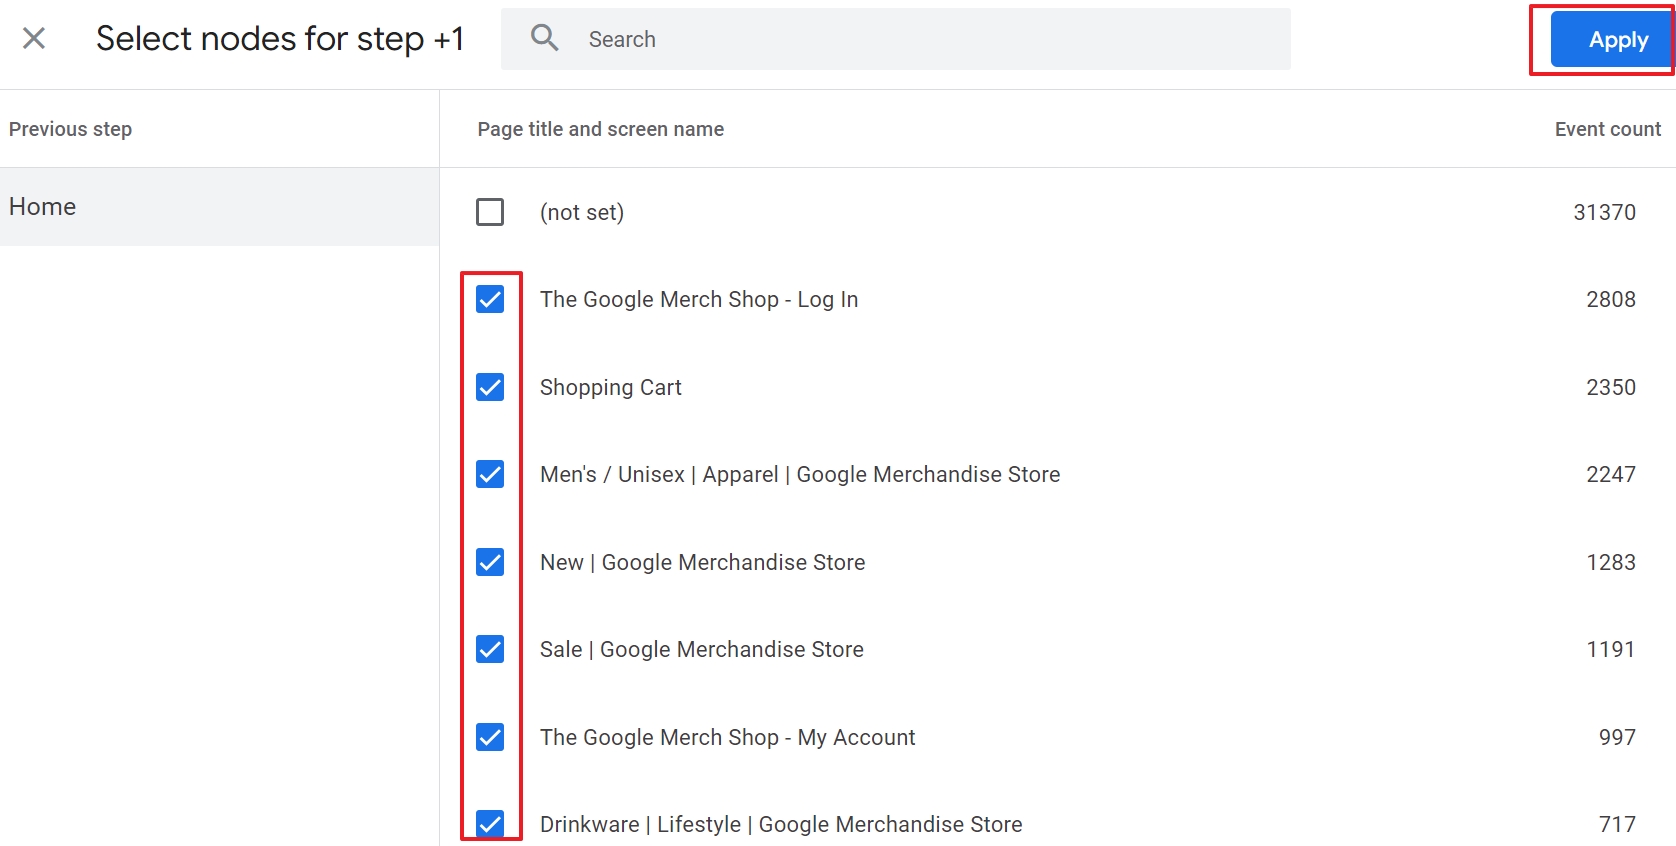
In Step+1, click on the pencil icon and select all the pages, except Not set. Then click Apply.
Click on the page on top of the column of Step+1. Now Step+2 appears and you need to look for Home in the column.
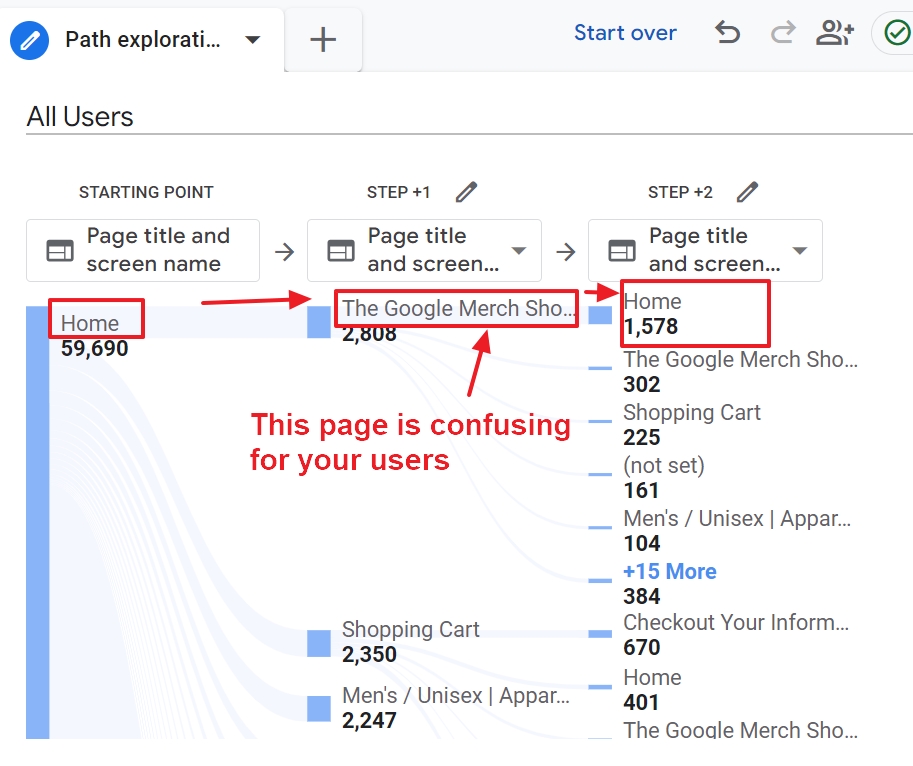
If you have a small number of people going back to your home page from a particular page, I wouldn’t worry about it.
But when you notice a substantial amount of people going back to your home page, you may have detected something that is bothering your users.
The question is what?
And in the same report, you can maybe find a clue. Let’s look at the following example.
On which type of devices do most visitors return back to the homepage?
Let’s continue with the previous path exploration.
But this time, we add a dimension to the path report.
You can see the ones that are available in the Variable panel. You can also add other dimensions, but let’s keep it simple for now.
Then, in the Settings panel, you click on Breakdown and choose Device Category.
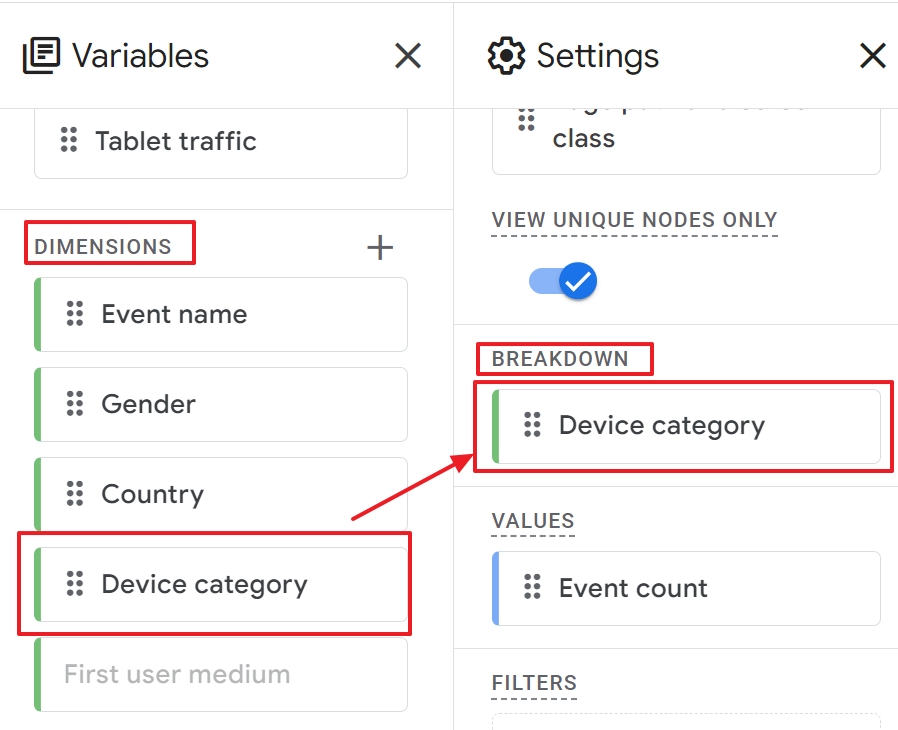
In your tree graph, you can now hover over the breakdown dimensions at the bottom and see the details for each device category.
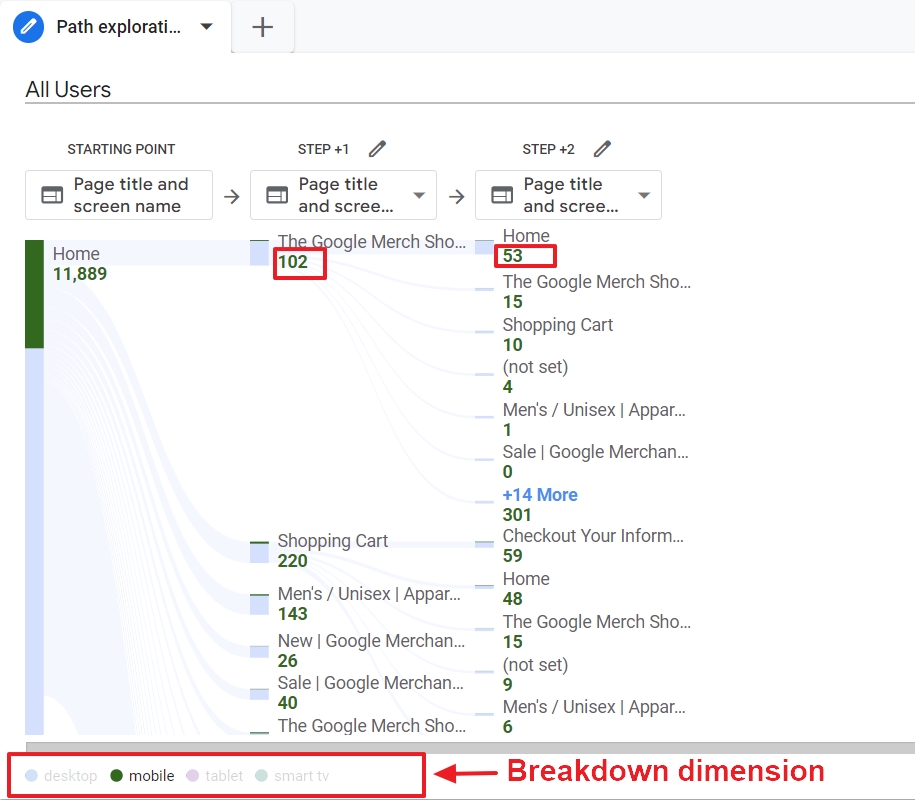
If you notice high numbers for a category, open your website with a device of that category. It is probably messed up.
Which events preceded the horrible app_exception?
GA4 can also be used to collect data from your Android and iOS apps. The path exploration report is just one example of how GA4 can be useful for your developers too.
To detect which events happened before an app_exception occurred, start a new path exploration report.
Choose app_exception as the ending point. And there you go.
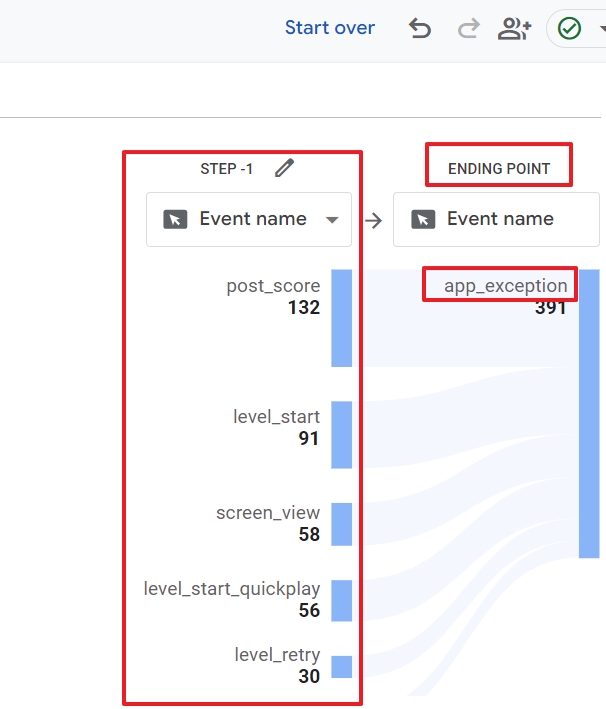
The report shows all the events that happened right before the app_exception event occurred.
BTW, this is an excellent example of a reverse path exploration. You start at the end of the journey and then you work your way back.
Of course, you can also do this for your website or web shop.
Can I create a reverse path analysis/exploration report in GA4?
Yes, you can. And what’s more, you better do it because it can reveal a lot more than a funnel analysis.
You see, a funnel is linear. But as you have understood by now, users have their own will and follow whatever path they want to. Or whatever path your website technology allows.
So, instead of doing a path analysis from the starting point of your users, you can do the reverse.
You choose the ending point. That is typically an action or a page that is associated with a conversion.
To give you a few examples:
- A thank you page that visitors see when they sign up for your newsletter, or when they have filled in a contact form.
- The checkout page for your web shop.
- The add_to_cart GA4 ecommerce event.
- Etc.
Pick one important page or action and make it the ending point of your reverse path exploration.
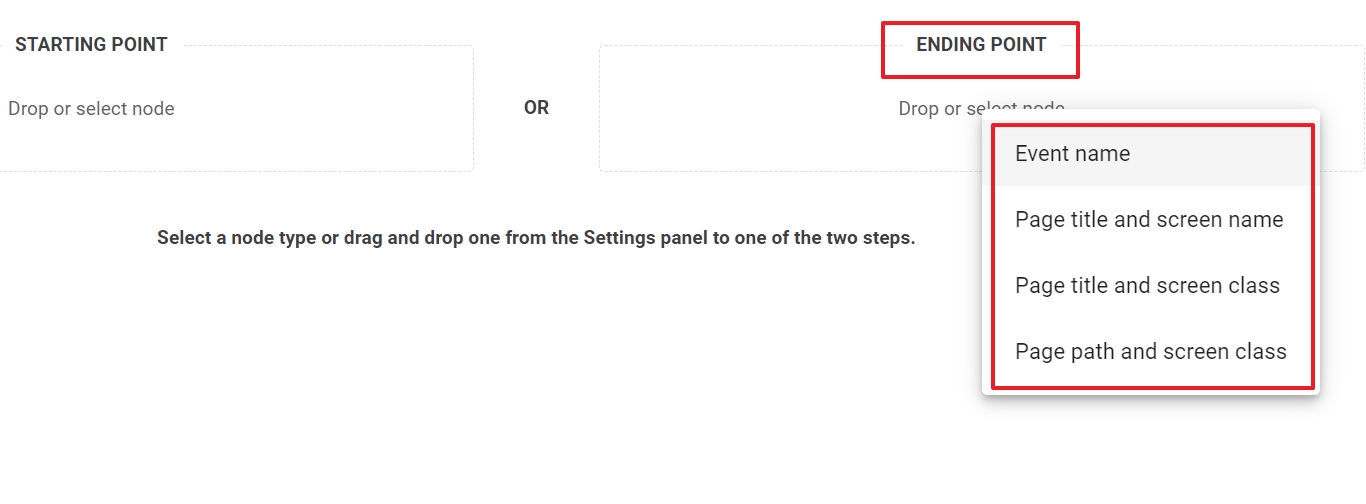
Then, when your report is being generated, you can switch the steps from events into pages.
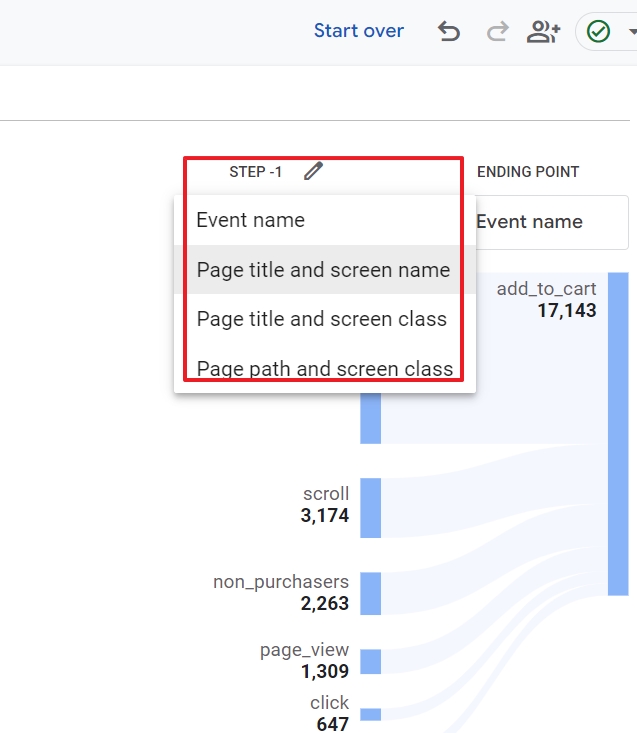
And if you click on an event, or a page, you can go back and see all the things your visitors did.
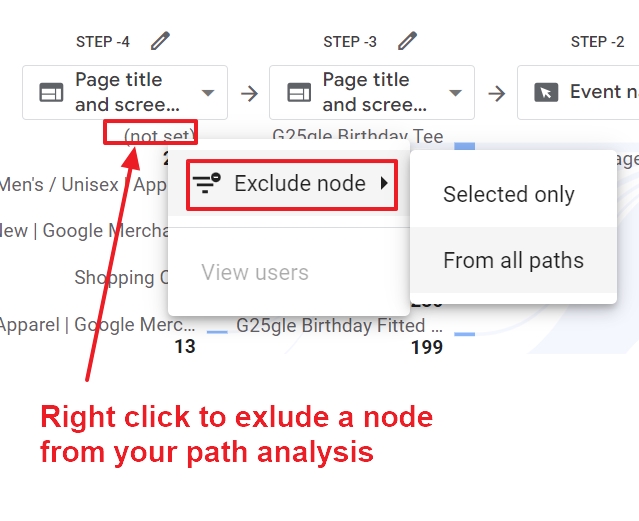
If you want to focus on certain events or pages, you can remove any node from your report. To do so, right-click on the node and then Exclude node.
And that’s it.
Best practices to create a customized path analysis report in GA4
Once you understand the value this report can bring to your business, you will likely create more of them. To save you time, you can best apply these tips.
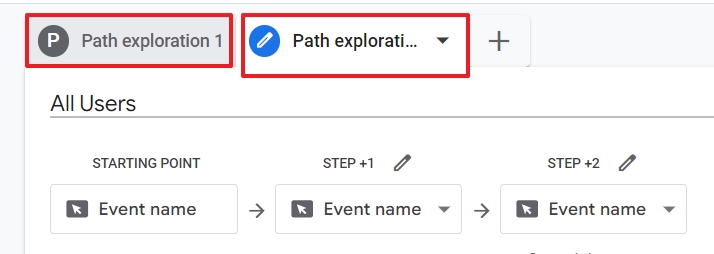
- Duplicate exploration reports
You can easily do that by clicking on the arrow next to Path Exploration and then click Duplicate.

You can do this with the default template, or with any other exploration report you build. Don’t worry about getting lost, because it is easy to switch between different explorations.
- Give your path exploration a descriptive name
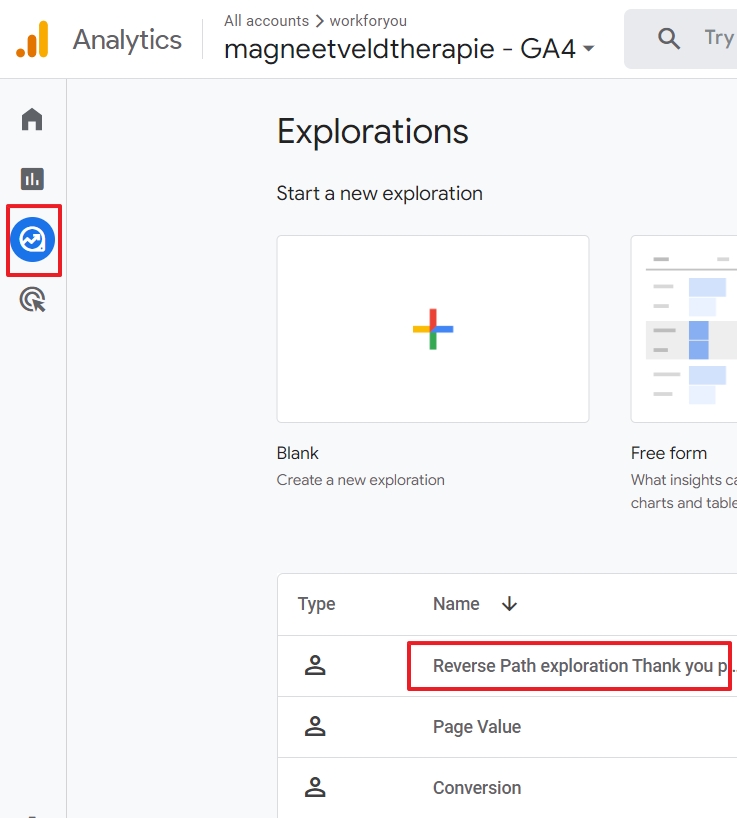
You can change the name of the report. That is particularly useful because there are many paths users can follow and you don’t want to recreate every single report every time you need it.

Later on, you can find your customized path exploration reports at the bottom of the Exploration page.
And now what?
You are probably eager to build your first path exploration report in GA4.
I hope the examples gave you a good idea about the power of this report. It can show you how visitors move around on your site. It also shows you what actions users are doing during one, or more sessions.
I also hope I stressed enough that it is important to understand what data you are exactly looking at.
The date range, the metrics, the segments and dimensions, the View Unique Nodes setting all have an impact on the data that is generated in the report.
Make sure you double check your Settings and Variable panel before using the data to make important decisions about your website.

You finally reached the ending point of this article and you have three options.
- Leave and dive into GA4.
- Continue your path on our website in the future.
- Or have a look at what our free newsletter can mean for data-driven business owners and marketers like you.
Whatever you choose, on behalf of the Data Driven U team, I wish you tons of good luck on your path.

