
EXPLORATION TEMPLATES
Build powerful analysis models in a few clicks
Google Analytics 4 has some awesome features in store for you, not the least of which are the newly available exploration templates.
So what are exploration templates in GA4?
You can customize templates found in the Explore section in the left-hand menu of your GA4 property. These templates allow you to go beyond standard reporting and analyze user behavior in-depth based on your needs.
Today we’re going to go through all the exploration templates available in GA4 and give you ideas on how to customize them. So come with us to learn all about this exciting new area of data collection and analysis that’s sure to be a favorite.
What Are Exploration Templates?
Previously named the analysis hub, the explore section of your GA4 account is one of the most valuable areas in the new platform. Since GA4 is still new, updates are rolling out all the time. This means a lot of the reports you’re used to seeing are not currently available, but hopefully, there will be more coming. In the meantime, you can use your exploration templates to create the reports you want to see.
Let’s go through the different exploration templates today and see what insights each one is designed to uncover. We’ll also give you examples and ideas of how to customize your templates based on your unique needs.
How to Access Exploration Templates
To get to your exploration reports, just go to “Explore” on the left. You’ll then see a list of suggested templates and a table below showing your ongoing and previous explorations. Click on “Template gallery” to see all available templates.

Once you’ve entered the template gallery, you’ll notice there are three sections with multiple templates available in each. You’ll see techniques, use cases, and industries.
We’ll explain each of the templates available in the sections below, so come with us as we explore the many options available for collecting and analyzing your data.
Exploration Templates Overview
Before we look at each of the available templates, let’s discuss the basic layout you’re going to see. No matter which template you choose, you’ll have the same three tabs available: variables, tab settings, and your output/results.
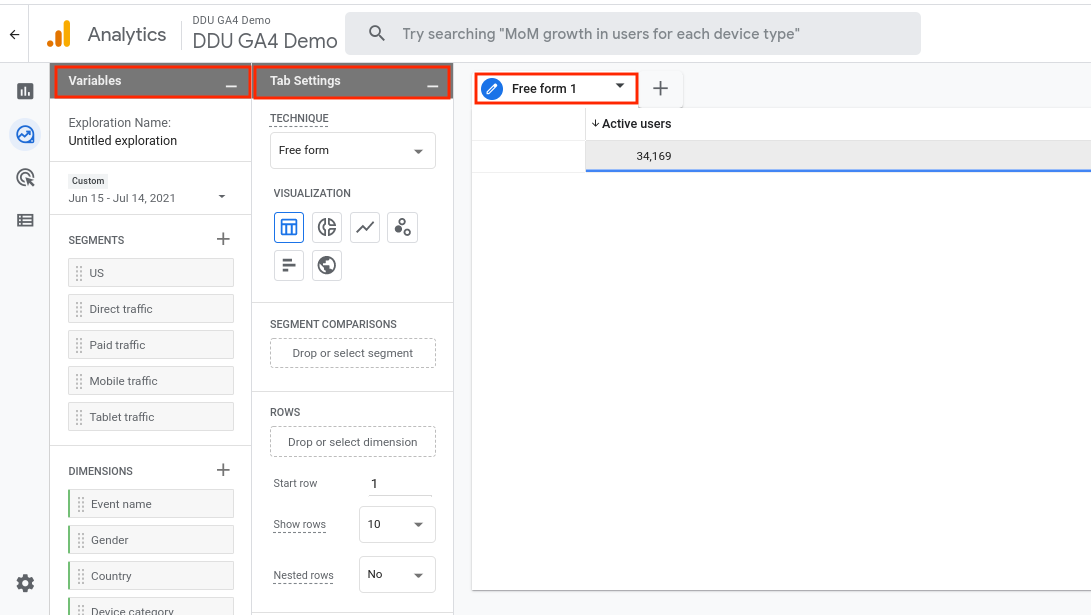
When you select a template, the “Technique” will change and so will the available options below. In this way, the templates act as a guide, prompting you with the necessary options to create your desired analysis based on your template of choice.
Let’s go through each of the different tabs briefly and then we’ll look at the templates. If you want to see more detail here, check out our previous post on GA4’s Explore section.
The variables section of your exploration templates is where you customize your segments, dimensions, and metrics. You’ll need to set them all up here, and then you can drag them over to the necessary section of “tab settings” to apply them.
Your segments can be user-based (like users who recently made a purchase), session-based, or event-based. To look at all your available options, just click the “+” sign.
When you get to dimensions, you’ll see that you can choose any dimension you want to add to your exploration. You can select events, demographic data, you name it! Whatever you want to explore will be included right here.
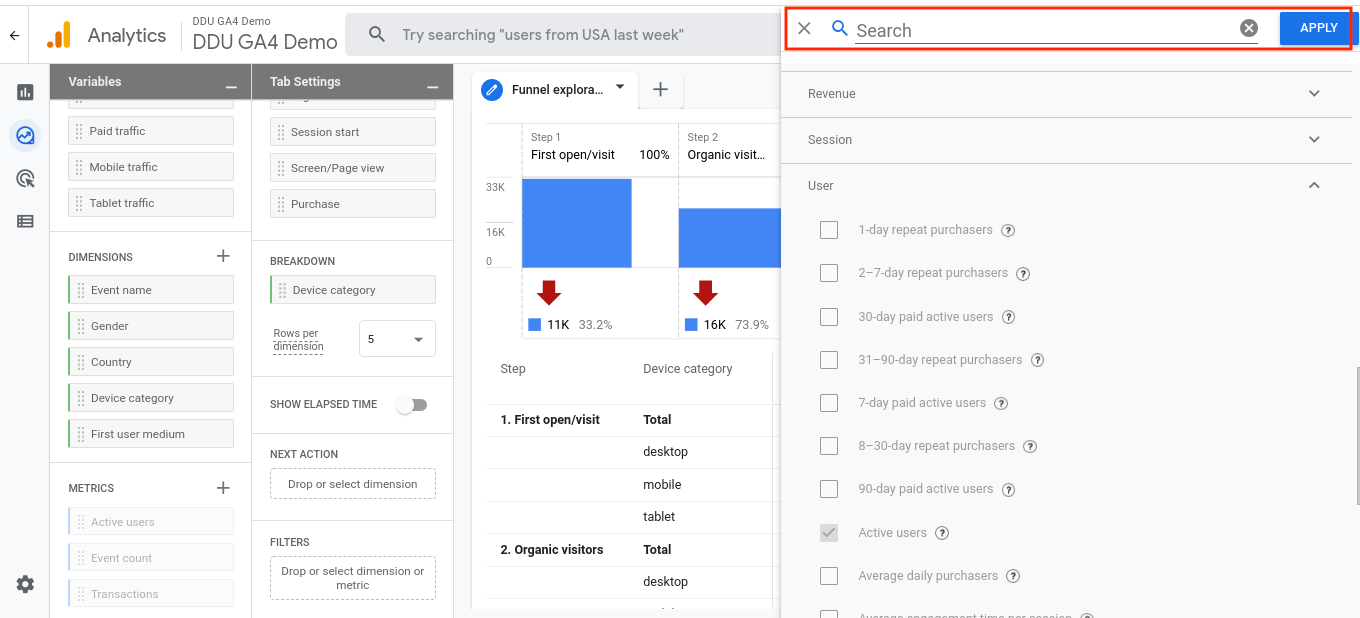
Finally, in the variables section, you have your metrics. Again here, you have endless options, and by clicking the “+” sign, you’ll see all of them. Analytics offers you a lot of suggestions, and you can use the search bar to make things easier if you know what you want to include in your exploration.
Okay, now onto the next section you’ll see in every analysis template: tab settings. In this section, you can make adjustments that affect what will be displayed in your output and how it will be laid out visually.
The first option in the tab settings section is your technique. This is how your exploration will be executed. Your options here are the same as the technique template options. When you select a technique (like funnel exploration, user explorer, etc), the rest of the tab setting options will adjust accordingly. Selecting your desired technique template will set this up automatically.
We’ll talk more about the different options that come up for each template in the sections below. So keep reading to learn more about the different exploration templates and learn how to make a sample report you may be missing since making the switch to GA4.
Blank
The first option in the “Techniques” section is to create a blank exploration. Here, you can select any combination of the abovementioned customizable elements, so the sky’s the limit.
In our previous post about the explore section of GA4, we discuss using a blank template, so check out that post for our ideas, suggestions, and breakdown. But, as promised, we want to show you an example report that you might be missing when making the shift from Universal Analytics to GA4, so let’s do it here.
One of the reports people love in UA is the landing page report. While it’s not currently available in GA4, you can create one of your own using the blank exploration template.
To create a landing page report similar to the one available in Universal Analytics, follow these configurations in the blank exploration template:
In variables:
- Under “dimensions,” click the “+” sign.
- A search bar will come up with options on the right. Search for “page path.” Note, if you don’t see this option, you’ll need to configure it as a custom dimension before configuring your exploration.
- Click “Apply.”
- Drag your “page path” dimension over to the “rows” section under “tab settings.”
- You’ll also want to select metrics for your exploration report, and this will vary depending on your needs. For our example, we’ll select “active users.”
In tab settings:
- Select “event name,” under “filters.”
- Select “exactly matches.”
- Type “session_start.” (This will trigger your exploration to focus on where a user starts their journey, i.e., their landing page.)
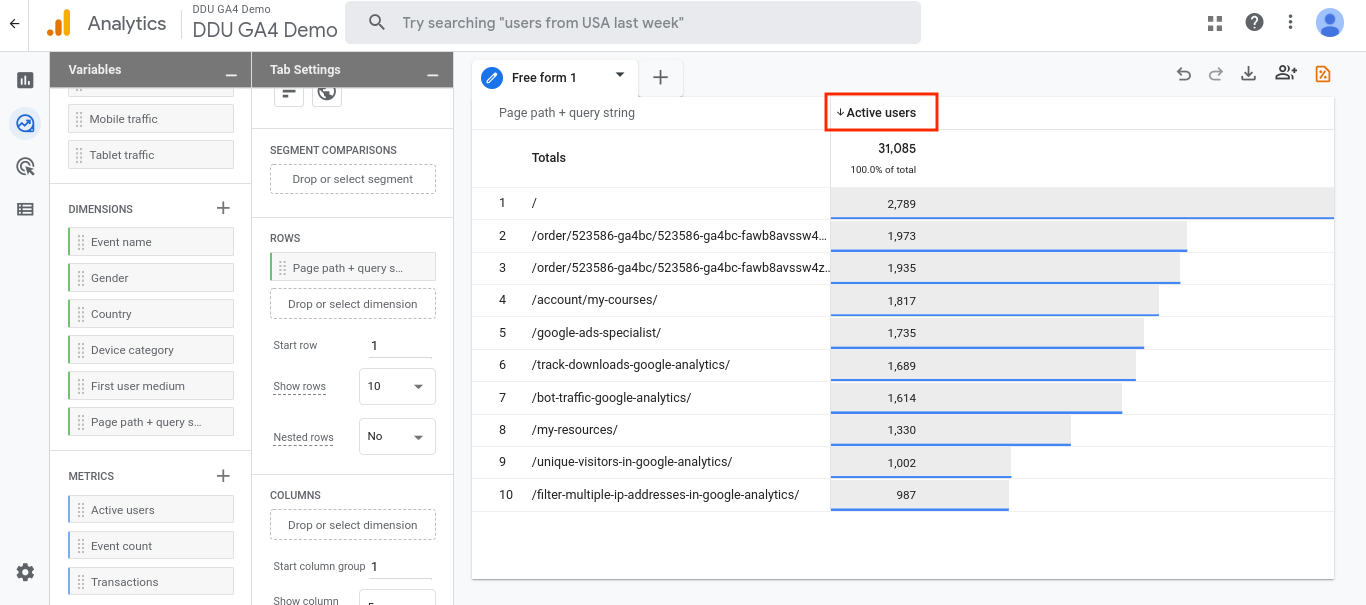
You’ll see your finished report appear on the right once you’ve entered all your configurations. Because we selected the metric of “active users,” our landing page report is organized according to the number of active users. This lets you see what page brought the active users to your site, which provides valuable insight into how certain pages are performing when it comes to engaging users.
Free Form
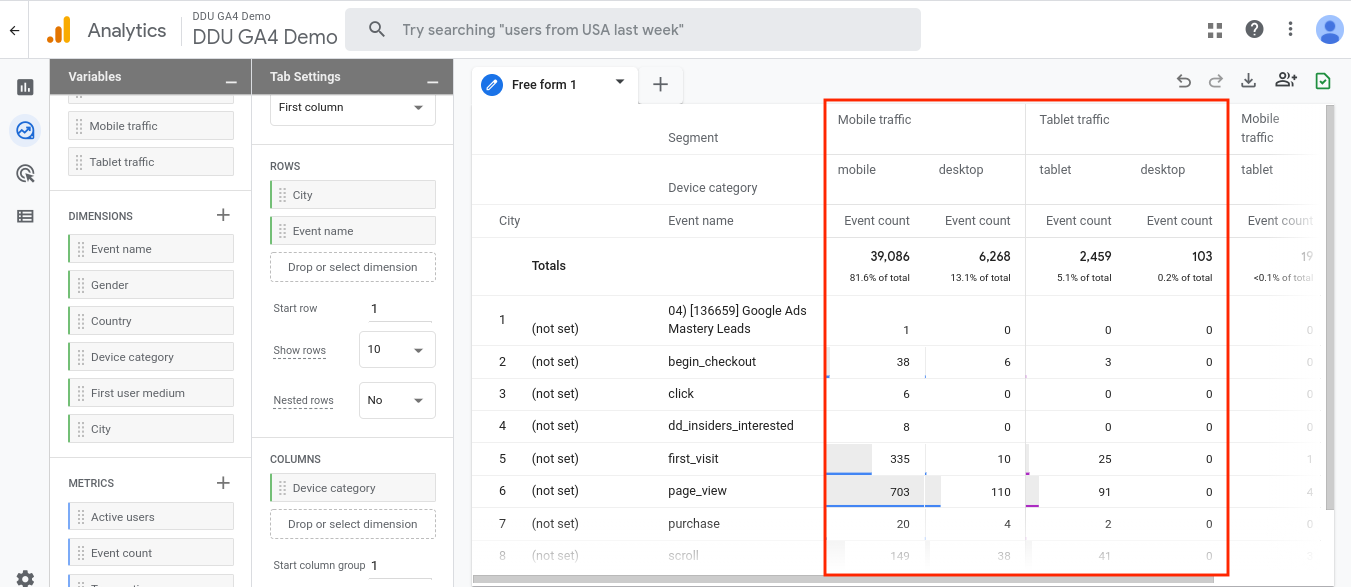
Free form is very similar to the blank template option, but here the focus is on creating custom charts and tables. You can customize columns and rows to create a unique visualization by dragging dimensions from “variables” to “tab settings.”
Free form is also ideal for things like tracking downloads or finding 404 pages.
Here in our sample free form exploration, we’re looking at event count as compared between mobile and tablet users.
Funnel Exploration
Your funnel exploration template is one of the most valuable. It allows you to track your user’s journey throughout your site, and you can look at all the steps along the way and see where people are falling out of your desired funnel.
The funnel analysis template is extremely useful, so we created a separate post just for that. To see our insights on GA4’s funnel analysis template, click here.
Path Exploration
Similar to funnel exploration, your path exploration reports let you follow your user’s journey throughout your site. With pathing reports, though, you’ll examine your user behavior using tree graphs to see where they go and how they interact with your site.
Here, you won’t examine users through specific funnels as you do in the funnel exploration, but rather, you’ll look at their organic behavior to gain insights. You can set up filters here like all your reports to see how users are behaving when they trigger certain events or belong to certain segments.
Segment Overlap
In this section, you can examine user behavior based on segments. When you look at the overlap between segments, you can gain valuable insights into shared behavior.
For example, you might want to examine user behavior based on gender and location. You can create a segment overlap exploration to see how men and women in different regions are behaving and use that to adjust your marketing efforts.
User Explorer
This is a very interesting and helpful template as you can look into individual user activities. Remember that your user data is based on the type of reporting identity you set up in Google Analytics. For more information about how to select your default reporting identity and what it means, check out our post here.
Here you can dive deep into individual user activities and uncover insights about patterns of behavior based on these activities. You can also look at demographic data and examine individual users on an intimate level while still maintaining user anonymity and following Google’s privacy guidelines for data collection.
Cohort Exploration
This is a great template because it looks at users as a “cohort.” Users are grouped based on common qualities and behaviors into a cohort. This is one of the ways Analytics can continue collecting user data while still maintaining user privacy. For more information on user cohorts and Google’s adjustments regarding user privacy, see our post here.
The other great thing about this template is it focuses on collecting cohort data over time, so you can see how effective your website/app optimization and marketing efforts have been paying off.
User Lifetime
Here, you can look into the entire lifetime of individual users. This can be extremely valuable for your remarketing campaigns because you can observe the efforts and changes that drove users away from your business.
You can also analyze those efforts that have kept users around and look at the demographic data surrounding those who have continued with your services.
Acquisition
Acquisition is the first option under “Use cases.” Using this template, you can dive into your marketing efforts to identify where you’re being effective and where your efforts are being wasted or need to be revised.
Acquisition is one of the most important metrics when it comes to data analysis, so GA4 already has a built-in acquisition section for you that includes traffic acquisition and user acquisition. For more information on your default acquisition reports, see our previous post here.
Conversion
Here, you can examine your user’s journey on the way to a conversion. In GA4, you can mark any event as a conversion, but you have to do it manually. Just toggle the switch to make an event a conversion when you’re creating or modifying it.

User Behavior
This is probably the closest to the landing page report we showed above in our blank template example, but it is unique in its way.
Here, you can analyze user behavior based on landing page, but you’ll be following their journey. This template is akin to merging your landing page report and path exploration report.
Ecommerce
The first of your two options in the “Industries” section is eCommerce. Here, you can look in-depth at your eCommerce platforms and their performance. This is another valuable area of reporting that you likely used in Universal Analytics.
Like the funnel analysis reports, eCommerce reporting is so valuable that GA4 has already set up a default report for you which can be viewed in the “Monetization” section. For more information on monetization reports, see our previous post here.
Gaming
In the gaming section, you can analyze how your games are performing if you have any available for your users and customers.
Note that you’ll need to set up events related to your gaming before collecting data for this report.
How is GA4 Different and What Are The Benefits?
Your exploration templates are new to GA4, but a lot of them are similar to ones available in Universal Analytics. Many of your exploration templates are just like the specialty reports you had in UA, but in GA4, there are more options and yet things have been streamlined as well.
In GA4, all your ad hoc reporting is combined in one place—the explore section. Having all your ad hoc reporting together here makes finding what you need much easier and more intuitive. This is especially helpful if you’re accessing your GA4 account from devices other than your computer, like your smartphone.
Also, these templates are highly customizable and yet provide you with clear direction and steps to take. They also create detailed visualizations for your data, making your data easy to understand.
Using Exploration Templates in Google Analytics 4
Your exploration templates in GA4 can lead to some of the most valuable reports in the entire platform. You can create a blank exploration or use one of the specific exploration templates to get started.
Using your exploration templates, you can generate a detailed visualization of user behavior and website and mobile app performance. This area is also key to creating visuals you can share with colleagues, investors, or clients.
How are you customizing your exploration templates in GA4? Let us know!
