See Where Your Conversion Rate Is Heading — Not Just Where It's Been
Most dashboards show you what happened last month. This Looker Studio template shows you what's likely to happen next month. It takes your historical conversion data and projects it forward so you can spot trends before they become problems.
MeasureU is trusted by 50,000+ digital marketers
Looker Studio template — connect your data source and start forecasting. No spam, ever.
MeasureU Has Been Featured In

 Google Ads
 What's Inside
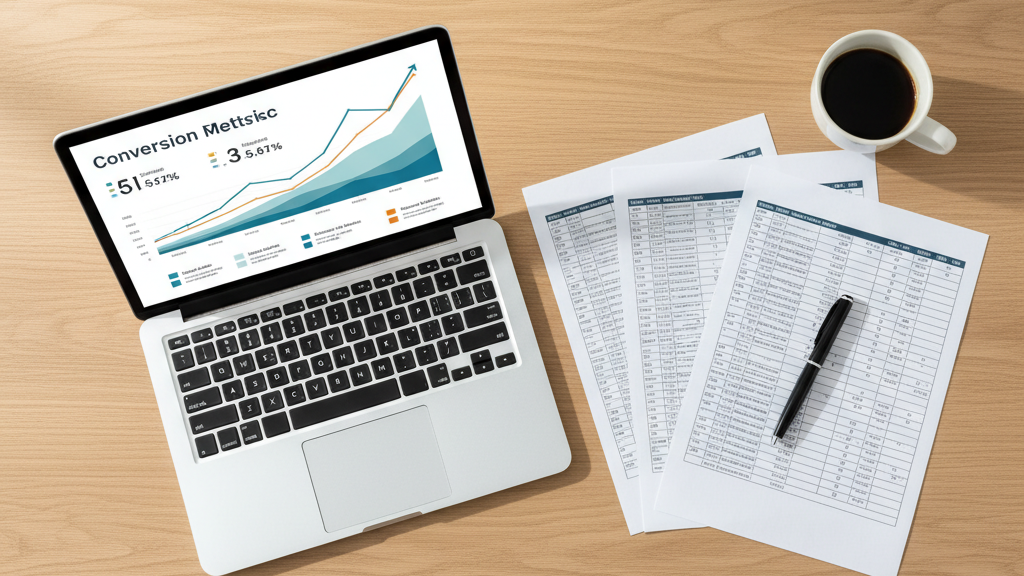
Trend Visualization
See your conversion rate plotted over time with a forecast line projecting the next 30, 60, or 90 days based on your actual data.
Benchmark Cheatsheet
Includes conversion rate benchmarks by industry and channel so you can see how your numbers compare to what other marketers are seeing.
Plug-and-Play Data Source
Connect your GA4 or Google Ads data source and the template populates automatically. No formulas to write, no data to export.
Works with GA4, Google Ads, and any data source you can connect to Looker Studio.
Conversion rate reporting usually means looking backwards. "Our conversion rate was 2.3% last month." Great — but is it going up or down? Is the trend accelerating? Will you hit your quarterly target at this pace? Most dashboards can't answer those questions.
This Looker Studio template adds a forecast layer to your conversion data. It takes your historical performance and projects it forward, so you can see whether you're on track or heading for a shortfall before it's too late to do anything about it.
- ✓ Reporting to stakeholders who ask "where are we headed?" The forecast chart gives them a visual answer. Show the trendline, point to the projection, and discuss what needs to change.
- ✓ Not sure if your conversion rate is good or bad? The built-in benchmark cheatsheet shows typical conversion rates by industry and channel. Context makes the number meaningful.
- ✓ Managing multiple campaigns or clients? Duplicate the template for each one. Each copy connects to its own data source and generates its own forecast.
- ✓ Want to set realistic conversion rate goals? Use the forecast to set targets based on your actual trajectory — not an aspirational number someone picked in a meeting.
Instant access. No credit card.
The Same Forecasting Approach Jeff Teaches in MeasureU
Jeff Sauer has been building Looker Studio dashboards since it was called Google Data Studio. This template uses the same forecasting methodology he teaches in his courses and applies to every client engagement.
Your conversion rate tells a story — this template shows you the next chapter
Connect your data, get a forecast, and start making decisions based on where things are going instead of where they've been.