Dimensions Tell You "Which." Metrics Tell You "How Much." This Guide Shows You 5 Ways to Combine Them.
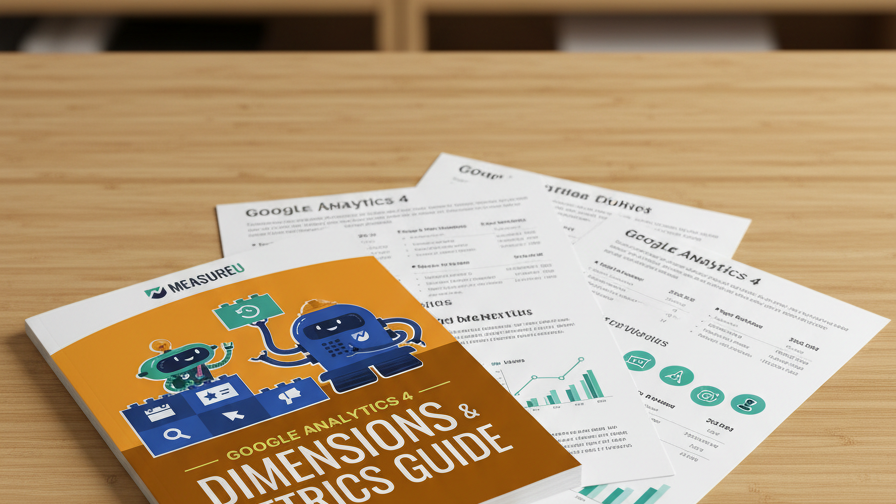
Every report in GA4 is built from two building blocks: dimensions (the attributes that describe your data) and metrics (the numbers that measure it). Once you understand how to pair them, you can answer almost any question about your website. This guide explains the concept, then walks through 5 real report examples with screenshots.
MeasureU is trusted by 50,000+ digital marketers
PDF download — delivered instantly. No spam, ever.
MeasureU Has Been Featured In

 Google Ads
 What's Inside
Dimensions vs Metrics Explained
A clear breakdown of what dimensions are (attributes like page path, source, date) versus what metrics are (quantities like sessions, users, conversions) — no jargon.
5 Real Report Examples
Sessions by date, traffic by source/medium/campaign, page performance by hostname, scroll depth analysis, and event-level reporting — each with a screenshot table.
From Confused to Confident in GA4
By the end of the guide you'll know which dimension + metric combinations answer which business questions, so you can build your own reports from scratch.
12 pages. Perfect companion to your first week in GA4.
GA4's reporting interface is built on one idea: pick the right dimensions, pair them with the right metrics, and you can answer any question about your website. The problem is that GA4 gives you hundreds of each and no guidance on which combinations actually matter.
This guide starts with the concept — what dimensions and metrics are, how they relate to each other — then immediately puts it into practice with five report examples you'll use regularly.
- ✓ New to GA4 and overwhelmed by the interface? The first section defines dimensions and metrics in plain language with everyday analogies, so you can build on a solid foundation.
- ✓ Want to see where your traffic comes from? Example 2 shows sessions broken down by date, source, medium, and campaign — the exact report you need for channel performance.
- ✓ Curious which pages people actually read? Example 3 pairs hostname and page path with session metrics to show which content drives engagement across your site.
- ✓ Want to know how far people scroll? Example 4 combines scroll percentage with hostname and page path so you can see exactly where visitors drop off on each page.
- ✓ Need to go deeper than pageviews? Example 5 digs into event-level data, showing how to use GA4's event model to track specific user actions beyond standard page metrics.
Instant access. No credit card.
Created by Someone Who's Taught GA4 to 50,000+ Marketers
Jeff Sauer has been working in digital analytics since 2005 — long before GA4 existed. He's trained marketers at every skill level through MeasureU, and dimensions vs metrics is the single concept he's found that makes everything else in GA4 click. This guide is how he teaches it.
Five report examples that show you how GA4 reporting actually works
Download the guide, open GA4, and build the same reports yourself. By example 3, the interface will start making sense.