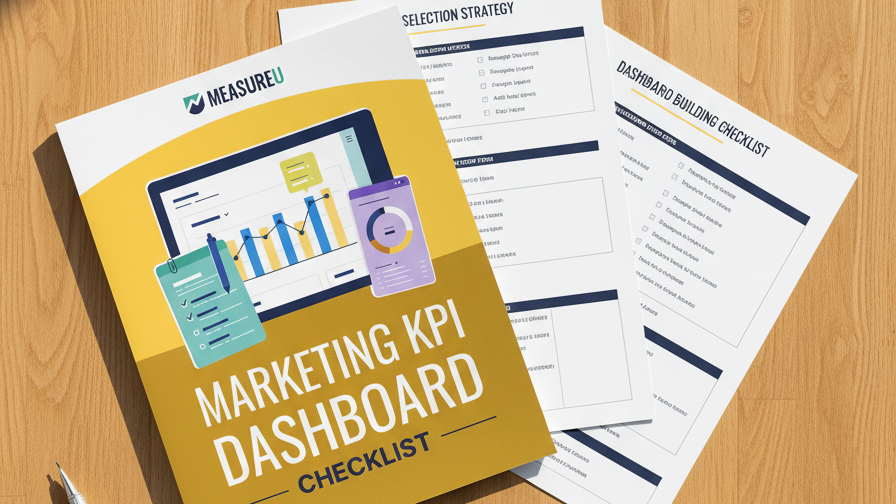
The Difference Between a Dashboard People Open and One They Ignore
Most marketing dashboards get built, shared once, and never opened again. Not because the data is wrong — because they answer questions nobody was asking. This checklist starts with your audience (who sees this report and what do they care about?) and works backward to the KPIs, visualizations, and delivery schedule that actually get attention.
MeasureU is trusted by 50,000+ digital marketers
PDF download — delivered instantly. No spam, ever.
MeasureU Has Been Featured In

 Google Ads
 What's Inside
Know Your Audience First
Before you pick a single KPI, figure out who reads this report, what decisions they make with it, and what "good" looks like to them. Section 1 walks through this.
Data Studio Setup, Step by Step
Connect GA4, add your first visualizations, adjust metrics and dimensions, and build a dashboard that answers questions at a glance. No prior Data Studio experience needed.
Analysis & Automated Delivery
What does the data actually tell you? And how do you get the report in front of the right people on a schedule? The last two sections cover both.
For marketers and analysts who build reports for stakeholders, clients, or leadership.
Here's something most analytics people learn the hard way: the dashboard that takes 20 hours to build with every metric you can find? Nobody looks at it. The one-page summary with three KPIs your VP actually cares about? That one gets forwarded to the CEO.
This checklist covers five sections. It starts where most people skip — understanding your audience — and then walks through KPI selection, Data Studio setup (connecting GA4, adding visualizations, adjusting metrics), analysis techniques, and setting up automated delivery so the right people get the right data on a schedule.
- ✓ Building reports that nobody reads? Section 1 helps you identify exactly who sees your report, what goals they have, and which KPIs actually matter to them. Answer these questions before opening Data Studio.
- ✓ Too many metrics, no clear story? Section 2 covers how to locate, organize, and prioritize KPIs so your dashboard tells a story instead of dumping a spreadsheet on someone's screen.
- ✓ Never used Data Studio before? Section 3 walks through setup from scratch — connecting GA4 as a data source, adding scorecards and charts, and adjusting the metrics so they show what you need.
- ✓ Dashboard looks good but you're not sure what to say about it? Section 4 covers analysis — how to read what the data is telling you and translate it into recommendations your stakeholders can act on.
- ✓ Tired of manually sending reports every week? Section 5 sets up automated delivery so dashboards arrive in inboxes on schedule, without you lifting a finger after the initial setup.
Instant access. No credit card.
Dashboards That Authorize Budgets and Advance Careers
Jeff Sauer has been building marketing dashboards since 2005. In that time he's watched data-driven arguments authorize budgets, approve projects, and even increase salaries. The common thread? The dashboards that get results aren't the prettiest ones — they're the ones that answer the right questions for the right people. This checklist makes sure yours does exactly that.
A dashboard nobody reads is worse than no dashboard at all
Download the checklist, build a report your stakeholders actually want, and watch what happens when the right people see the right data.