
or join Academy for $49/mo
The Reporting You Rebuild Every Month, Built Once and Automated
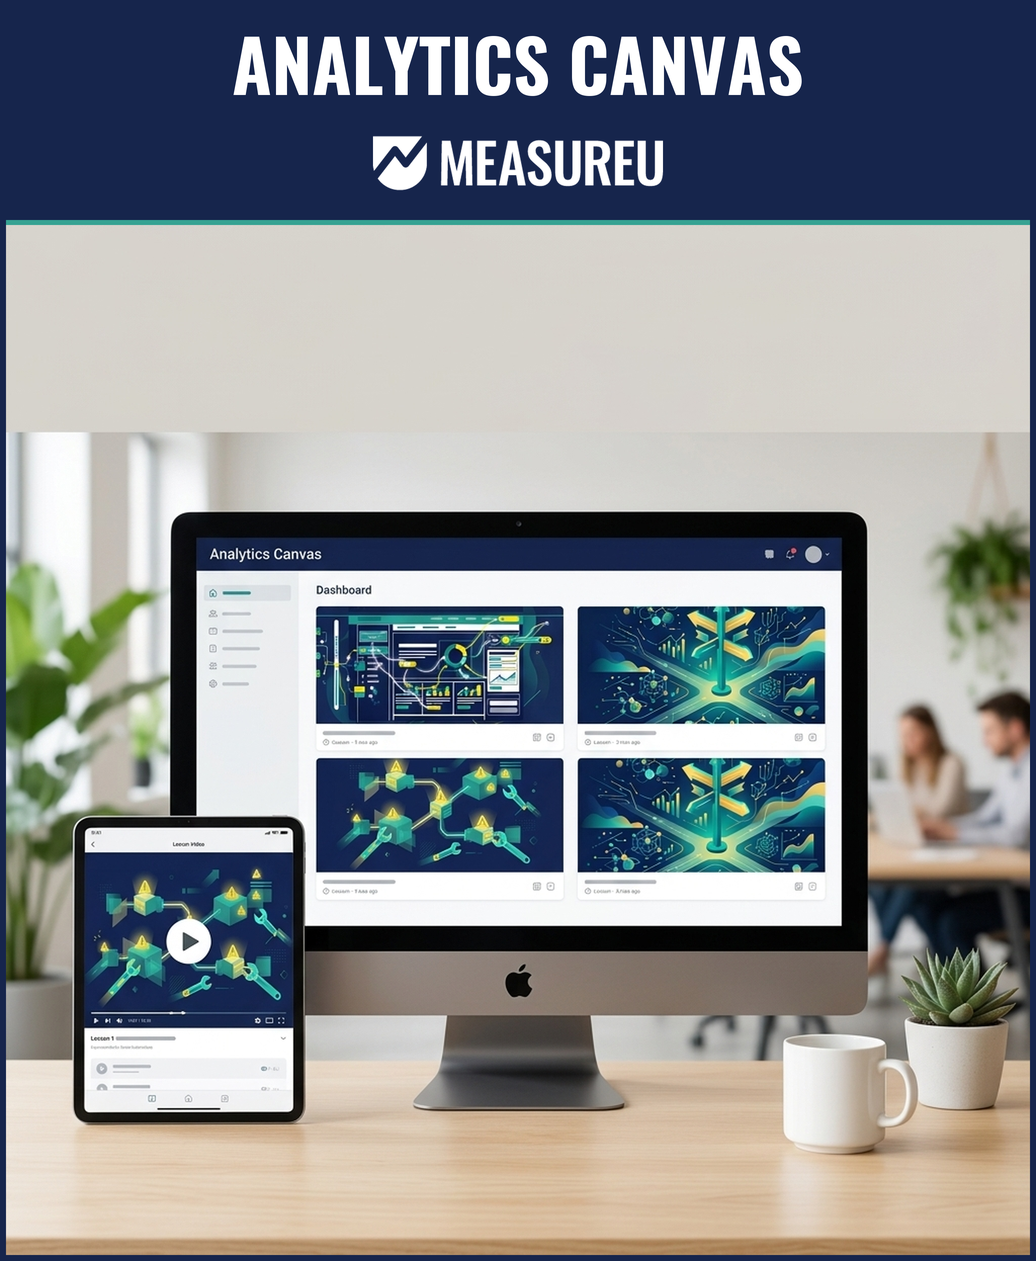
Analytics Canvas sits between GA4 and your reports: it pulls the data, transforms it with visual blocks instead of code, and refreshes Data Studio on a schedule. This course covers the full workflow from planning through troubleshooting. 26 video lessons across 4 modules. Taught by Manisha Mistry.
- Pull GA4 data through the API without sampling headaches
- Build transformations with visual blocks: filter, summarize, calculate
- Lifetime access with free course updates
- Also included with MeasureU Academy ($49/mo)
Course Curriculum
Four modules. 26 lessons. From planning to a pipeline that runs itself.
1 Foundations
- What Analytics Canvas is and why use it
- How it compares to hand-built reporting workflows
- Pricing plans and which tier fits your work
- A tour of the Analytics Canvas interface
Result: You'll know where Analytics Canvas fits in your stack and how to find your way around it.
2 Plan
- Planning your dashboard before you build it
- Tables, dimensions, and metrics: mapping what you need
- Deciding what gets automated first
Result: You'll have a dashboard plan grounded in the data you actually need, not whatever the default connector spits out.

3 Build
- Building a GA4 exploration first, then pulling data via the GA4 API
- Filter, summarize, and calculation blocks
- Data Studio export blocks and report building
- Scheduling your canvas so it runs without you
Result: You'll ship an automated pipeline: GA4 data in, transformations applied, Data Studio report refreshed on schedule.

4 Troubleshooting
- Data heatmap and data profiler for spotting problems
- Column definitions and where mismatches hide
- Fixing automatic package errors
- Next steps once your first canvas is live
Result: You'll diagnose broken canvases yourself instead of staring at a failed refresh wondering what changed.
What You'll Walk Away With
Skills you can use the week you learn them
A Reporting Pipeline That Runs Itself
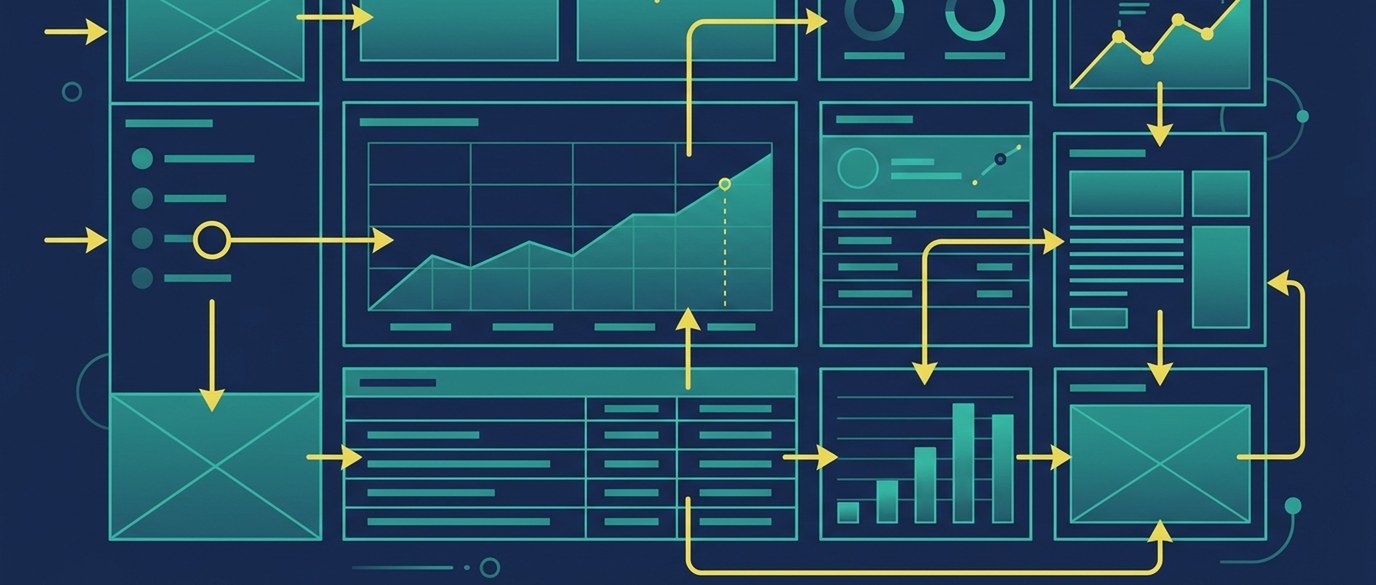
GA4 data pulled on schedule, transformed, and delivered to Data Studio. The monthly report work you do by hand, automated once.
A Plan Before the Build
Tables, dimensions, and metrics mapped to the questions your report answers, so you build the right pipeline the first time.

Transformations Without Code
Filter, summarize, and calculation blocks that do what you'd otherwise script, and stay readable for the next person who opens the canvas.

A Repair Kit for Broken Reports
Data profiler, heatmap, and column-definition checks that find the break in minutes, before your client finds it in the meeting.
Ready to Stop Rebuilding the Same Report?
26 lessons. 4 modules. Plan, build, schedule, troubleshoot. Yours for life.
Your Instructor

Manisha Mistry
Technical Director
Manisha runs technical architecture for MeasureU's enterprise clients: the tracking systems, data pipelines, and reporting automation behind 6-9 figure brands. Analytics Canvas is one of her working tools, and this course teaches it the way she uses it on client work.
- ✓ Enterprise tracking and data architecture
- ✓ Reporting automation for client accounts
- ✓ Co-teaches the MeasureU GTM course
Two Ways to Get This Course
Get Analytics Canvas on its own, or get everything with Academy
Analytics Canvas Course Only
Lifetime access to this course
- The complete Analytics Canvas Course — 4 modules, 26 lessons
- Lifetime access — learn at your own pace
- Free course updates
- Expert Community access
MeasureU Academy
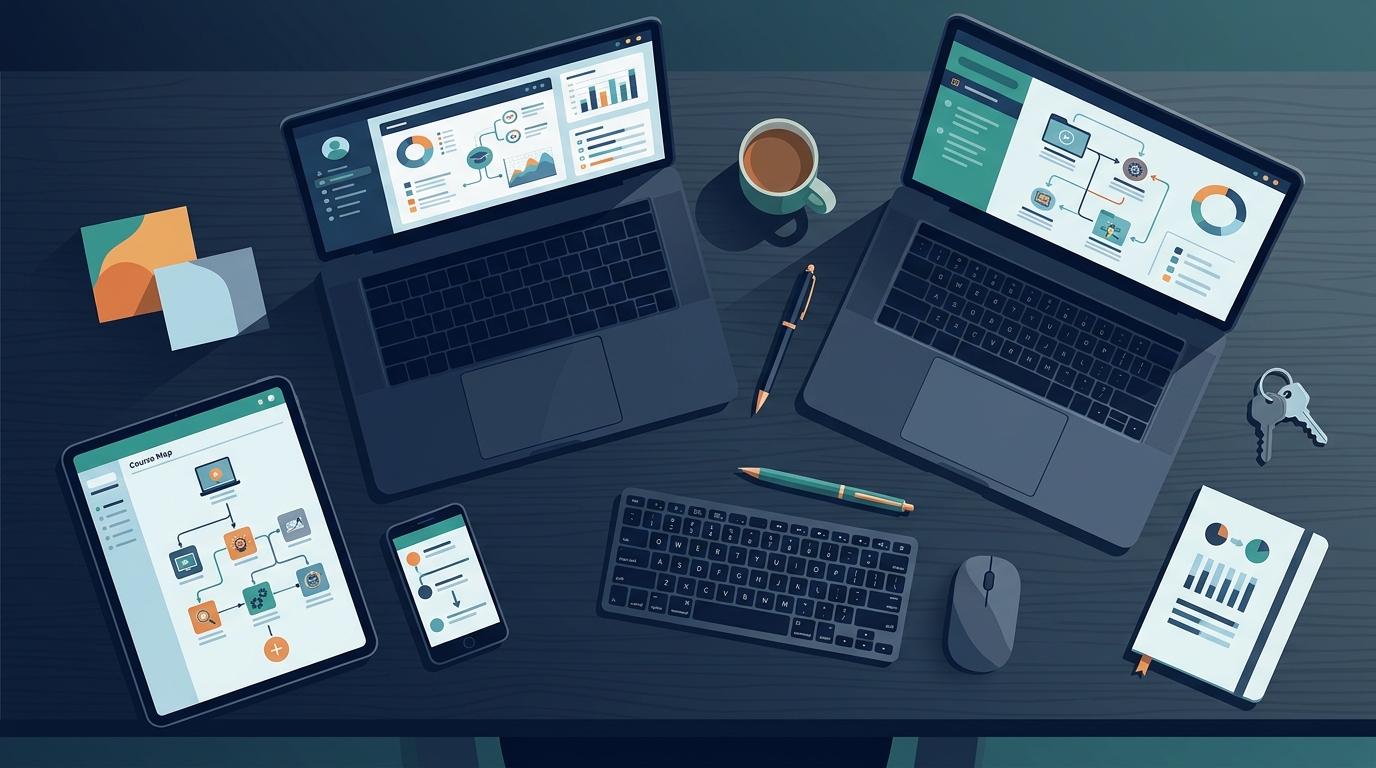
All 13 courses + tools + community
- This Analytics Canvas Course + 12 other courses
- GA4, GTM, BigQuery, Data Studio, and more
- Tools, templates, calculators, frameworks
- Full community access
- Cancel anytime — no commitment
100% Money-Back Guarantee
If the course isn't what you expected, email us within 30 days for a full refund. No questions asked. No hoops. No guilt trips.
We've been teaching analytics long enough to know this works. But you shouldn't have to take our word for it.
Frequently Asked Questions
+ − What is Analytics Canvas, exactly?
+ − Does the course include the Analytics Canvas tool?
+ − Can I buy this course on its own?
+ − What's the difference between this course and Academy?
+ − How is this different from just using Data Studio connectors?
+ − Can I get a refund?
+ − Who teaches this course?
+ − What if I get stuck?
Build the Report Once. Let It Run.
26 lessons from plan to automated pipeline. Lifetime access. Updates included.