
The 14-Slide Template That Gets Your Marketing Reports Read Instead of Deleted
You did the work. You pulled the numbers, built the charts, and found the story in the data. Then the report landed in an inbox and never got opened. Most marketers nail the analysis and lose the room on the presentation. This template gives you the exact structure Jeff uses to turn a month of data into a report executives actually read.
MeasureU is trusted by 50,000+ digital marketers
PowerPoint download, delivered instantly. No spam, ever.
MeasureU Has Been Featured In



 Google Ads
 What's Inside
An Executive Summary That Lands
The elevator-pitch slide you write last and put first: a 1-2 minute read for the people who will only ever open one slide. Get it right and the rest of the deck becomes optional.
KPI & Performance Tables
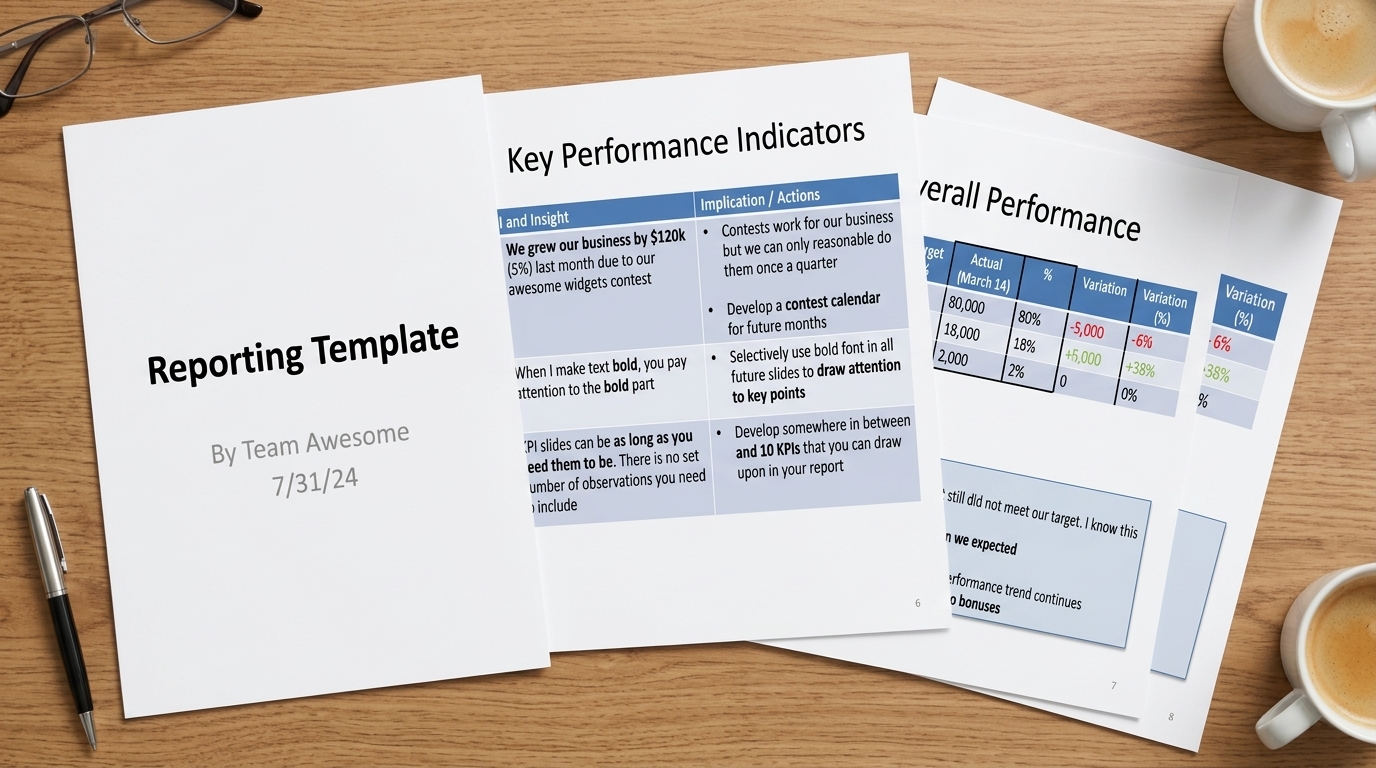
Pre-built tables for your key metrics and your Target-vs-Actual results, with the Good / Bad / Unsure breakdown that shows leadership exactly where you stand at a glance.
Observations + Implications
The framework on every slide that makes a report self-explanatory, so the person reading it at 11pm without you in the room still knows what each number means and what to do next.
Built for marketers, analysts, and agency teams who report to clients or leadership. Works for weekly, monthly, quarterly, or annual reports.
Most marketing reports die on the first slide. The work is usually fine. The report just gets built like a data dump instead of a story: forty slides of screenshots, no clear takeaway, and a busy executive who closes the tab after ten seconds.
This template is the opposite. It's a sequence: executive summary, the KPIs that matter, overall performance against target, then the supporting detail for anyone who wants to go deeper. Every slide is built to answer three questions: what happened, what it means, and what we're doing about it.
- ✓ Reports that never get a reply? The Executive Summary slide gives busy stakeholders the whole story in about 90 seconds. It's the one slide that actually gets read, sitting first but written last.
- ✓ Drowning leadership in numbers? The KPI table pairs every metric with its insight and the action it points to, so nobody has to interpret a chart on their own.
- ✓ Hard to show whether you hit the goal? The Overall Performance table lays out Target vs. Actual with a clear Good / Bad / Unsure split in green and red, so there's no ambiguity about where you landed.
- ✓ Report gets forwarded and loses its meaning? Observations and Implications on every slide keep it self-explanatory, even for the person reading it a week later without you there to narrate.
- ✓ Not sure where the deep data goes? The Appendix holds the detail so your main report stays tight. It's there if someone asks, out of the way if they don't.
Instant access. No credit card.
Built by Someone Who Reported to Clients for Years
Jeff Sauer built and ran a digital marketing agency before founding MeasureU, where he's trained 50,000+ marketers. This is the same reporting structure his team used to report to clients for years, on retainers where the monthly report was the main thing the client saw.
14 slides between a data dump and a report people actually read
Download the template, drop in your numbers, and send a report that gets opened. Works for weekly check-ins, monthly reviews, and quarterly presentations alike.