Two out of three companies don't trust their own marketing data.
That's not me pulling a number out of thin air—a 2025 study found that 67% of organizations looked at their dashboards and went “yeah… I don't really believe these numbers.”
And you probably already knew that. Not because you read the study. Because you've felt it.
You open up Google Analytics, something looks off. The conversions don't match what your sales team told you. The traffic numbers seem weird. And you just… close the tab and move on with your day.
Sound familiar?
I've been doing this for over 20 years and I can tell you—that feeling in your gut? Not paranoia. Your data probably IS broken.
And the price tag on that is bonkers. IBM put it at $3.1 trillion a year across US businesses. Trillion with a T. That's not a typo.
That's where the CLEAN Data Scorecard comes in.
I'm going to walk you through 10 questions—that's it, 10 questions—that'll show you exactly where your data is broken and where to start fixing it first.
Nobody ever gave you a starting point for this stuff. You've been looking at broken dashboards with no idea what's wrong or what to touch first. And THAT is what gets you—not the bad data itself, but the overwhelm of not knowing where to begin.
So let's fix that.
Watch the Full Breakdown
In this video, I break down every single question in the scorecard and explain exactly what each one is really asking:
Clean data isn't about perfection—it's about understanding where your gaps are so you can prioritize fixes. Five categories, two questions each. The whole audit takes 2 minutes.
What You'll Learn in This Post
- Why 67% of companies don't trust their own marketing data—and what's actually causing it
- The CLEAN framework: five categories that cover every gap in your marketing measurement
- How broken conversion tracking can waste 30-40% of your ad spend without you realizing it
- Why your team keeps arguing about “conversions” (and the 5-minute fix)
- The difference between a dashboard that drives decisions and one that's basically a screensaver
- How to score yourself in under 2 minutes and know exactly what to fix first
Table of Contents
- Why I Built This (After Waiting 20 Years for Someone Else To)
- The CLEAN Framework: What Each Letter Actually Means
- C Is for Collect: Are You Tracking What Actually Matters?
- L Is for Label: Why Your Team Can't Agree on What a “Conversion” Means
- E Is for Enhance: Fix Your Conversion Tracking Before It Costs You 40% of Your Ad Spend
- A Is for Assemble: Stop Opening 17 Tabs Every Time Your Boss Asks “How's Marketing Doing?”
- N Is for Narrate: Turn Your Dashboard from Screensaver to Strategy Tool
- How to Interpret Your Score
- Take the 2-Minute CLEAN Data Assessment
Why I Built This (After Waiting 20 Years for Someone Else To)
I'm Jeff Sauer. I've spent 20 years in digital marketing and for most of those years I kept waiting for somebody—ANYBODY—to create a framework for this. Like a clear, simple way to look at your data and go “ok, here's where the problem is.”
Nobody did.
And I don't say that to sound dramatic. I mean it. Twenty years of watching marketers stare at dashboards confused and nobody built a damn checklist. No rubric. No starting line. Nothing.
So we built one. At MeasureU we created what I'm calling the CLEAN Data Scorecard. And it's what should have existed since Google Analytics launched.
Here's the thing you need to know about it—clean data is NOT about perfection. That trips everybody up. They hear “clean data” and think “oh great, one more thing I'll never get right.”
No. It's about understanding. It's a process. You go through the steps, you make improvements, and your data gets more useful over time.
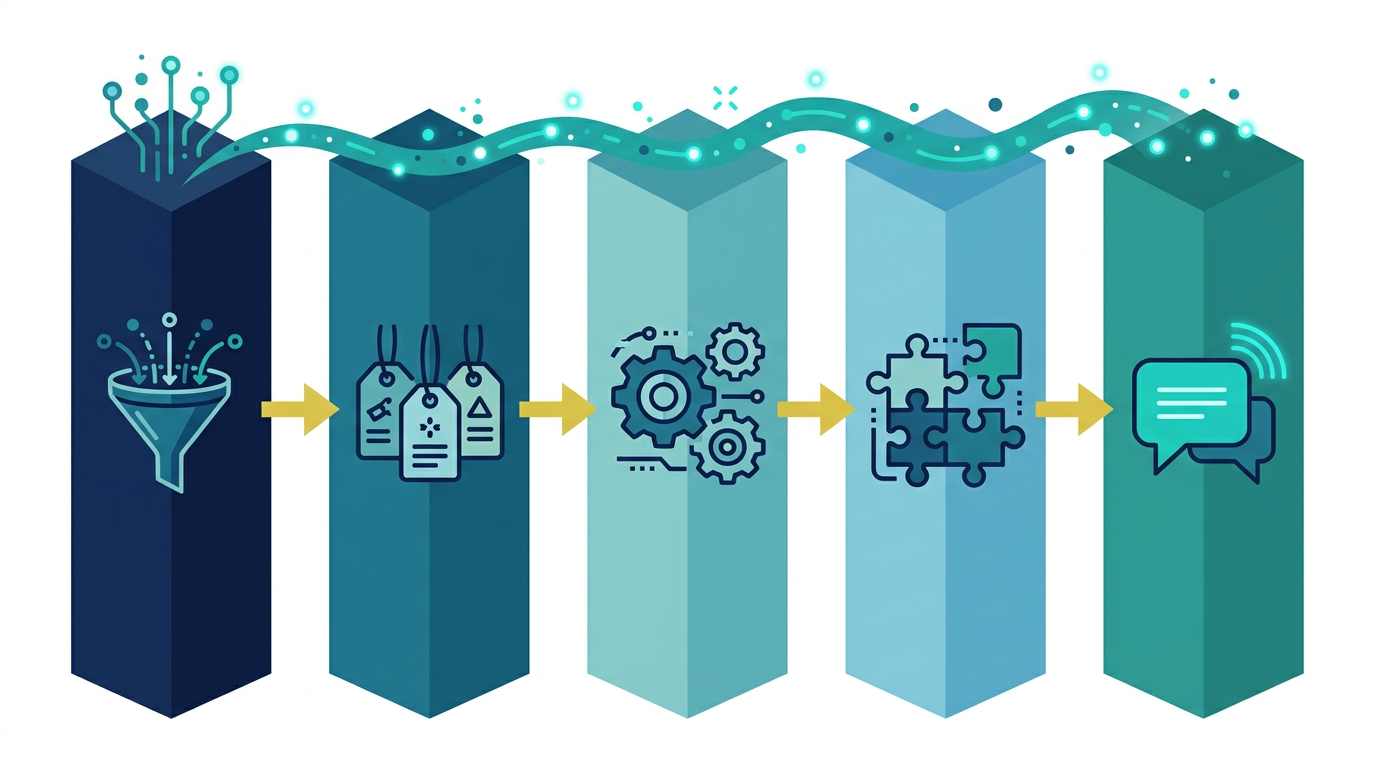
The CLEAN Framework: What Each Letter Actually Means
Five categories. Two questions each. Ten questions total. That's the whole scorecard.
The categories spell CLEAN—which, yeah, I'm a little proud of that one:
- C — Collect
- L — Label
- E — Enhance
- A — Assemble
- N — Narrate
Let me walk you through what each one is actually asking.
C Is for Collect: Are You Tracking What Actually Matters?
This is the most fundamental category because if you're not collecting the right data in the first place… nothing else matters.
It's like trying to bake a cake but you forgot to buy eggs. Doesn't matter how good your oven is.
The two questions in this category are basically asking:
- Do you know what's being tracked on your website right now?
- Is it actually working?
Because here's what I see all the time. Somebody set up Google Analytics—or migrated to GA4—three years ago. Maybe it was you, maybe it was a contractor, maybe it was that one IT guy who left the company in 2022. And since then? Nobody's checked.
What goes wrong:
- Tags break
- Tracking codes get removed when you redesign the site
- Stuff just… stops working and nobody notices because nobody's looking
And then six months later your boss asks “hey how did that campaign do?” and you pull up a report full of question marks.
The worst part—most people don't even realize their collection is broken. They see numbers and assume everything's fine. Numbers are showing up! Must be working!
Not necessarily.
Collect is your foundation. Are you gathering data? And is what you're gathering actually reliable? If you can't answer both of those confidently, everything built on top of that is shaky.
L Is for Label: Why Your Team Can't Agree on What a “Conversion” Means
This one is sneaky because it SOUNDS boring but it's where most of the arguments happen.
Here's what I mean.
You're in a meeting. Marketing says “we got 200 conversions last month.” Sales goes “no you didn't, we only closed 40 deals.” And then someone from the executive team chimes in with a completely different number from a completely different report.
Everyone's looking at each other like they're speaking different languages.
And the problem isn't that anyone is lying. The problem is nobody sat down and agreed on what a “conversion” even means.
- Is it a form fill?
- A phone call?
- A booked demo?
- A closed deal?
- A qualified lead?
Because if marketing is counting form fills and sales is counting signed contracts, you're going to get wildly different numbers and BOTH sides think they're right.
So that's the first thing Label is asking:
Does your team have a clear, agreed-upon list of what counts as a conversion? Like written down somewhere. Not vibes. Not “oh yeah we all know.” Actually documented.
The second piece is naming.
And I know—I KNOW—UTM parameters are not sexy. Nobody has ever gotten excited about UTM parameters at a dinner party.
But if one person on your team tags a campaign “summer-sale-2025” and another person tags the same campaign “2025_summer_promo” and a third person doesn't tag it at all…
Your reports are garbage. Full stop.
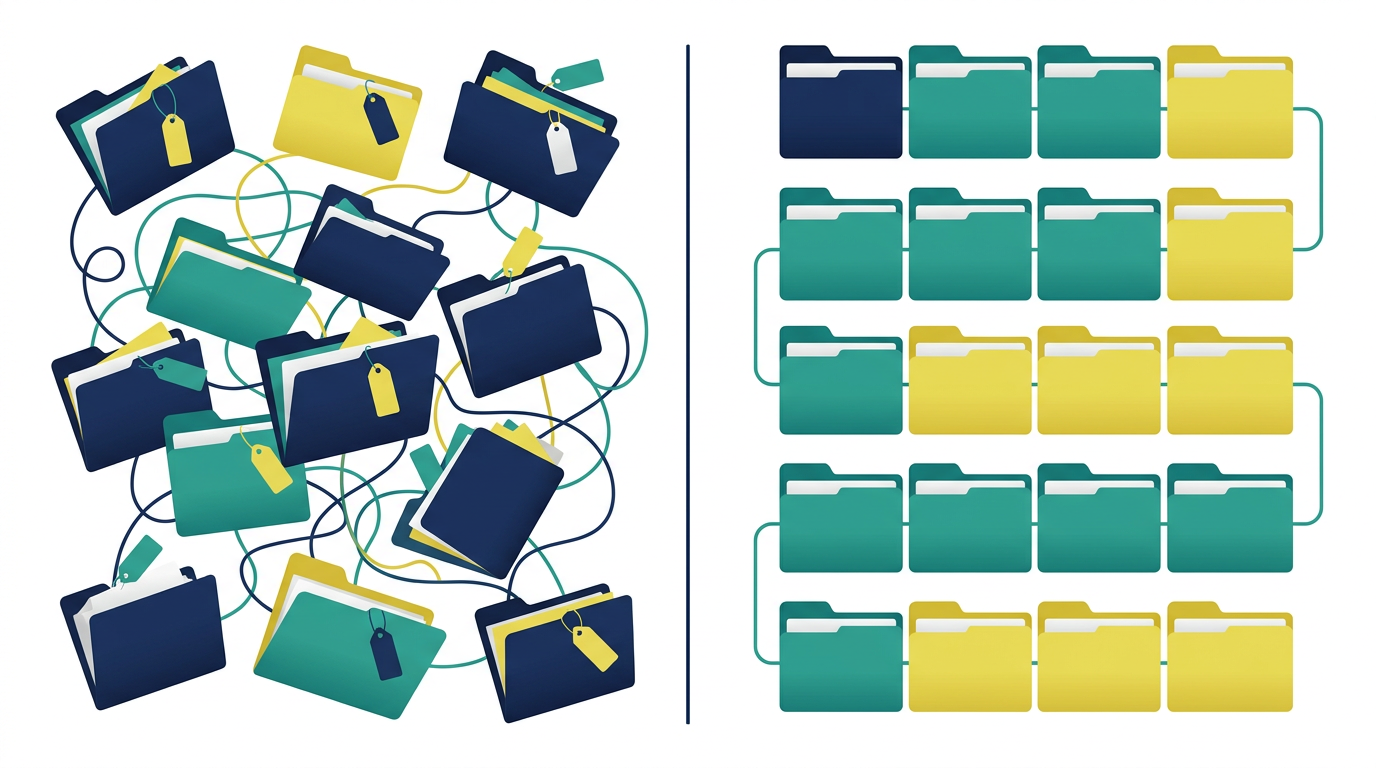
You can't answer “which campaign drove the most revenue” if everyone's labeling stuff differently. It's like having a filing cabinet where half the folders are alphabetical, a quarter are by date, and the rest are just shoved in randomly.
Good luck finding anything.
Consistent naming conventions. Same format, every time, everyone on the team. It sounds so basic but I promise you—maybe 1 in 5 companies I've worked with actually do this well.
E Is for Enhance: Fix Your Conversion Tracking Before It Costs You 40% of Your Ad Spend
I told you this one is costing you money so let me explain why.
This category is about making sure your ad platforms can actually see what's happening on your website. And right now, for a LOT of you, they can't. Or at least not as well as they used to.
Here's the deal:
You're running Google Ads or Meta ads or whatever. You're spending money. And those platforms need to know when someone clicks your ad and then does something valuable—buys something, fills out a form, books a call.
That connection between “clicked the ad” and “became a customer” is conversion tracking. And specifically what matters now is first-party conversion tracking.
Why First-Party Tracking Matters Now
The old way—where ad platforms just dropped cookies on everybody and tracked them across the internet—that's dying. It's mostly dead already.
- Browsers are blocking it
- Privacy laws are killing it
- Apple threw a grenade into it a few years ago
So if you haven't switched to first-party tracking, your ad platforms are flying blind. They can't see which clicks turned into customers. Which means they can't optimize. Which means you're paying more for worse results and you might not even realize it.
I've seen companies waste 30, 40 percent of their ad spend because of this. And they had no idea. They just thought “ads are getting more expensive” and accepted it.
No. Your tracking was broken.
The Cookie Consent Gap
Short version—when people decline your cookie banner, they disappear from your data. Could be 30 to 60 percent of your traffic, gone.
There's a way to recover most of that. The quiz will tell you if you have it set up.
If you're running ads in 2026 and you haven't nailed both of these, you are making decisions based on incomplete information. And incomplete information leads to bad decisions. That's not opinion. That's math.
A Is for Assemble: Stop Opening 17 Tabs Every Time Your Boss Asks “How's Marketing Doing?”
Honestly this might be the most relatable one on the list.
Here's the question—when your boss or your client asks “how's marketing doing?” … where do you go?
Because for most people the answer is “uh, everywhere.”
- You log into Google Analytics
- Then you check Meta Ads Manager
- Then you open Google Ads
- Maybe pull up HubSpot
- Maybe check Shopify
- Maybe dig through a spreadsheet somebody made four months ago that's already out of date
And by the time you've got all those tabs open you forgot what you were looking for in the first place.
That's an assembly problem.
What Assemble Is Really Asking
- Do you have a single place where you can look at your marketing performance and get the big picture? Not five places. One.
- Can you see what you SPENT and what you GOT BACK across all your channels in that one place? Like cost from Google AND Meta AND whatever else, sitting next to the conversions they drove?
Because if you can't see spend and results side by side, you're guessing. You might be dumping money into a channel that stopped working two months ago and you wouldn't know because the data lives in six different tabs.
This doesn't have to be complicated. It could be a dashboard, it could be a report, I don't care what it looks like. It needs to exist.
One place. Cost and results. Together.
That's it. That's Assemble.

N Is for Narrate: Turn Your Dashboard from Screensaver to Strategy Tool
Last one. And this is where the whole thing either pays off or falls apart.
Because you can collect the data. Label it properly. Enhance your tracking. Assemble it into one place. And STILL get nothing out of it.
How? By never actually doing anything with what you're looking at.
And I see this all the time. Someone builds a beautiful dashboard. Charts, graphs, colors, the whole thing. It looks amazing. And then every Monday the team opens it up, stares at it for ten minutes, goes “huh, ok” and closes the tab.
Nothing changes. No decisions get made. The dashboard is basically a screensaver at that point.
Narrate Is About the “So What”
When you look at your reports, do they lead to an actual next step?
Not “interesting”—a DECISION:
- We're going to shift budget here
- We're going to pause that campaign
- We're going to double down on this channel because the numbers say so
And when something looks wrong—when a number drops or a campaign tanks—can you figure out WHY and what to do about it? Or do you just stare at the red arrow pointing down and go “well that sucks.”
Because data without a story is a spreadsheet. Data WITH a story is a strategy.

That's Narrate. That's the whole scorecard. C-L-E-A-N.
How to Interpret Your Score
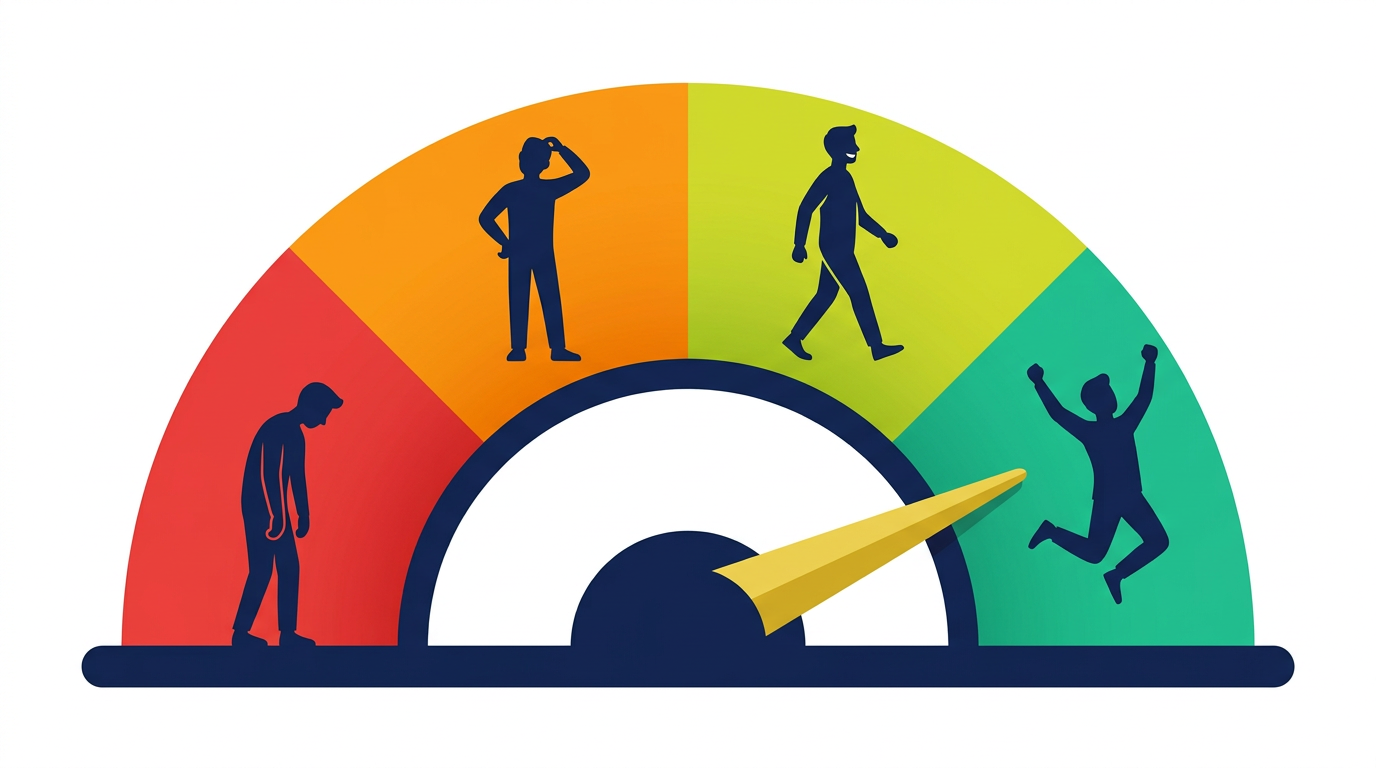
Before you take the quiz, here's what different score ranges typically mean:
| Score | What It Means |
|---|---|
| 8-10 | Data Champion (rare—don't get cocky) |
| 5-7 | Functional but Fragile (one bad hire or site redesign away from chaos) |
| 3-4 | Critical Gaps Exist (you're making some decisions blind) |
| 0-2 | Flying Blind (but hey, at least now you know) |
Here's the thing I didn't mention earlier—your score isn't pass or fail. Nobody gets a perfect ten. I've worked with Fortune 500 companies who'd score a five on this thing.
So don't be embarrassed. Honestly the lower scores are more useful because they show you exactly where to focus instead of trying to fix everything at once.
Take the 2-Minute CLEAN Data Assessment
So that's the CLEAN Data Scorecard. Ten questions across five categories.
If you're sitting there right now thinking “I don't know how I'd score on most of those”—good. That's the whole point.
Because most marketers have never stopped to audit this stuff. They just keep running campaigns and pulling reports and hoping the numbers mean something. And then they wonder why their marketing feels like guesswork.
It's not because you're bad at marketing. It's because nobody gave you a way to check whether your foundation was solid before you started building on top of it.
Here's What I Want You to Do
We turned this scorecard into a free quiz. Takes about two minutes. You answer the ten questions and at the end you get a score plus a breakdown of exactly where your gaps are.
Not vague “you should improve your data” advice. Specific. Like “your labeling is strong but your assembly is a mess and here's what to fix first.”
Take the Free CLEAN Data Quiz →
Ready to find out where your marketing data is actually broken? Go take the quiz—and once you have your score, check out MeasureU Pro to get step-by-step guidance on fixing every gap the scorecard reveals.