What’s going on with our AI traffic? Do we have any leads from AI yet? What about revenue? Are those AI optimization things actually working?
I’ve heard these questions. My students have heard them from clients. And honestly? Most people set up their AI traffic channel group in Google Analytics 4 and then… just kind of stare at it, wondering what to do next.
Here’s the thing: as AI search tools like ChatGPT, Perplexity, and Google’s AI Overviews send more traffic to websites, tracking this stuff isn’t optional anymore. Your clients are asking. Your boss is asking. And “I don’t know” stopped being an acceptable answer about six months ago.
So let’s talk about what to actually do once you’ve got that custom channel group set up. And if you haven’t set it up yet? Don’t worry—we’ll cover a workaround that gets you answers in the next 15 minutes, even with view-only access.
Watch the Full Breakdown
Prefer to read? Here’s the full walkthrough—from finding your AI traffic in GA4 reports to building a client-ready dashboard and the case-statement shortcut that works even without admin access.
What You'll Learn in This Post
- GA4 only allows three custom channel groups total—use one for AI/LLM traffic and keep it above Referral in priority order
- How to track sessions, leads, and revenue from AI traffic directly in GA4's Traffic Acquisition reports
- How a Data Studio dashboard lets you show clients AI traffic insights without teaching them GA4 navigation
- Why the case-statement workaround works with view-only access—perfect for prospecting or limited-permission situations
Table of Contents
- Quick Refresher: Setting Up Your AI Custom Channel Group
- How to Find AI Traffic in Google Analytics 4 Reports
- Building a Client Dashboard in Data Studio
- Haven’t Set Up the Channel Group Yet? The Case Statement Workaround
- Get Your Free AI Traffic Dashboard Template
Quick Refresher: Setting Up Your AI Custom Channel Group in Google Analytics 4
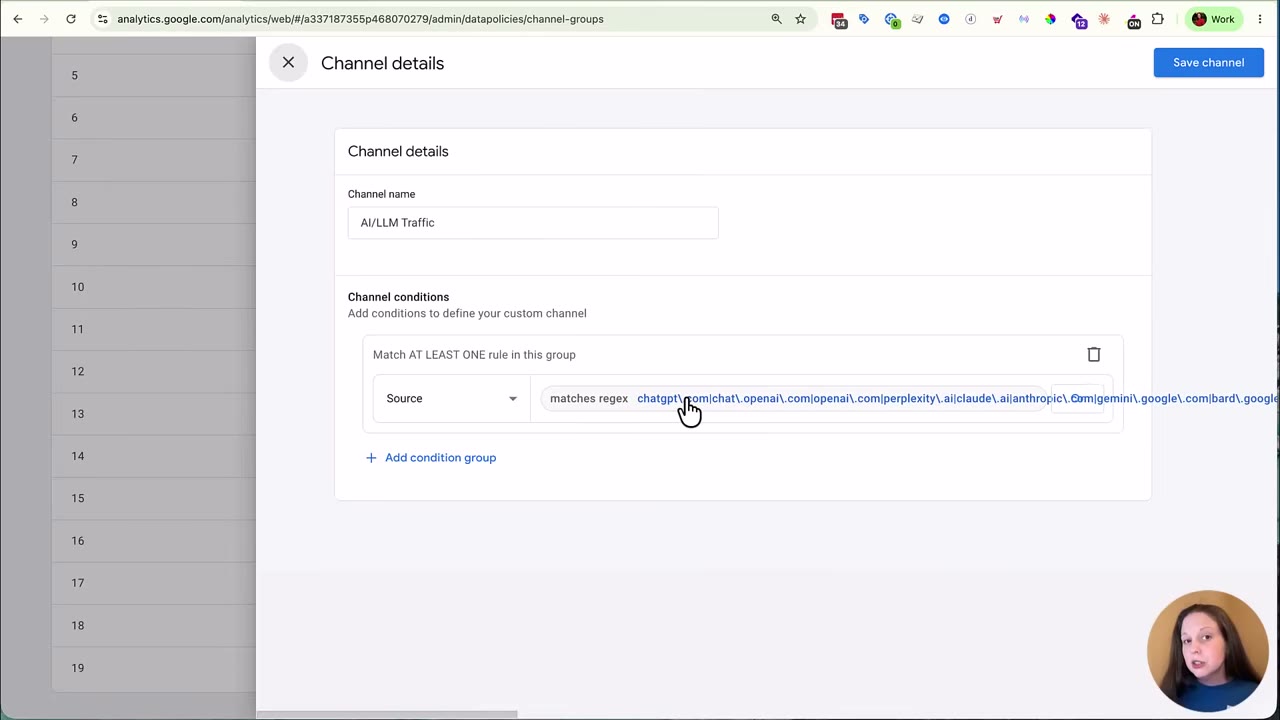
Before we get into reporting, let’s make sure your setup is solid. Head to your GA4 property and find Channel Groups under the Display Data section.
A few things to keep in mind:
- GA4 only allows three custom channel groups total. So choose wisely. We built one for ourselves, then another when we taught this process about a month later. That’s two of our three slots gone.
- Don’t label it just “AI.” Those two letters show up in tons of unrelated words and domains. The consensus among experts is to use something like “AI/LLM” instead, so it doesn’t accidentally grab traffic from, say, a company with “AI” in its name that has nothing to do with chatbots.
- Keep your AI channel above Referral in the priority order. This is the part people forget. If Referral sits higher, it’ll claim your AI traffic before your custom channel can.
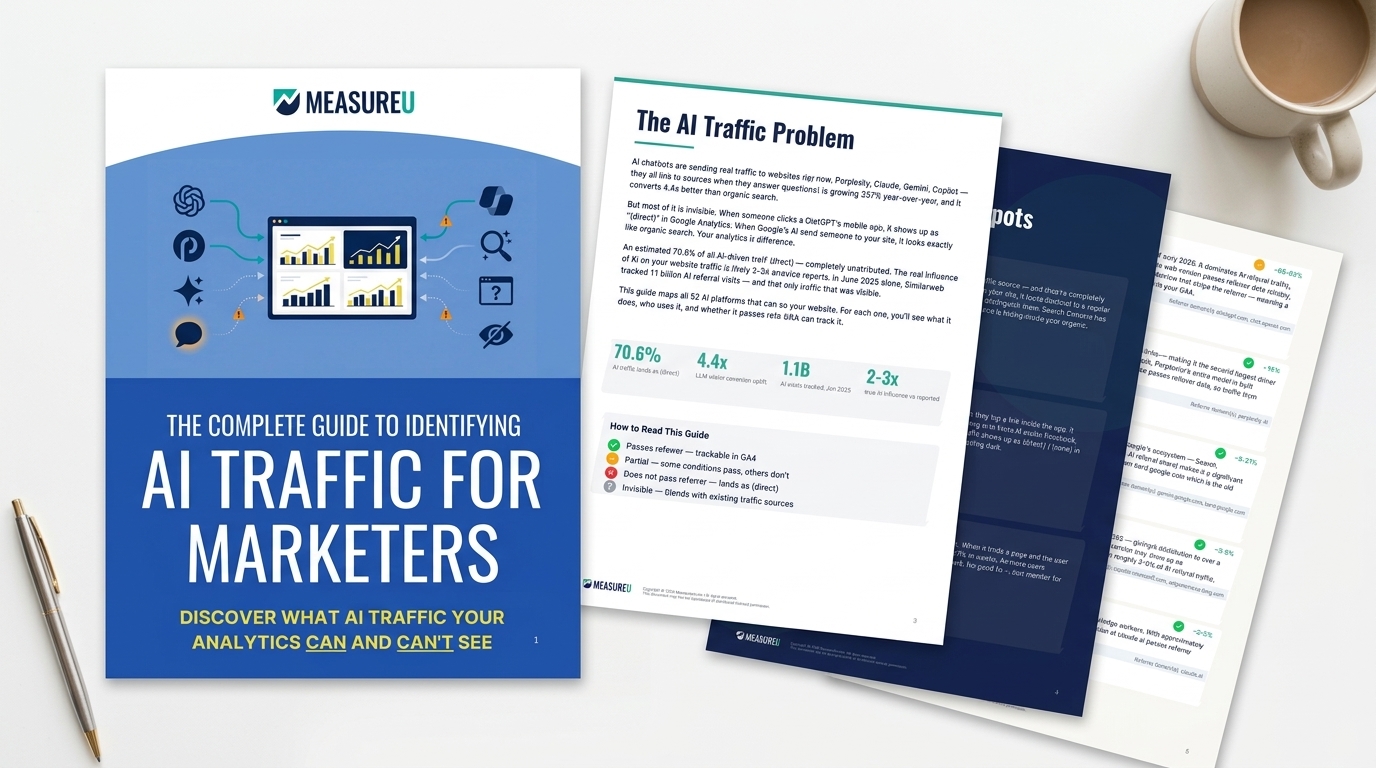
When you first set this up—maybe late 2025 or early 2026—your list of channel conditions was probably short. But now there are over 50 different sources and parameters that count as AI traffic: Perplexity, ChatGPT, Claude, various AI search features… and the list keeps growing.
If you’re missing some, just update your channel conditions. Give it a couple of hours and your reports will reflect the change.
How to Find and Analyze AI Traffic in Google Analytics 4 Reports
Setup’s done. Now let’s actually look at what this traffic is doing.
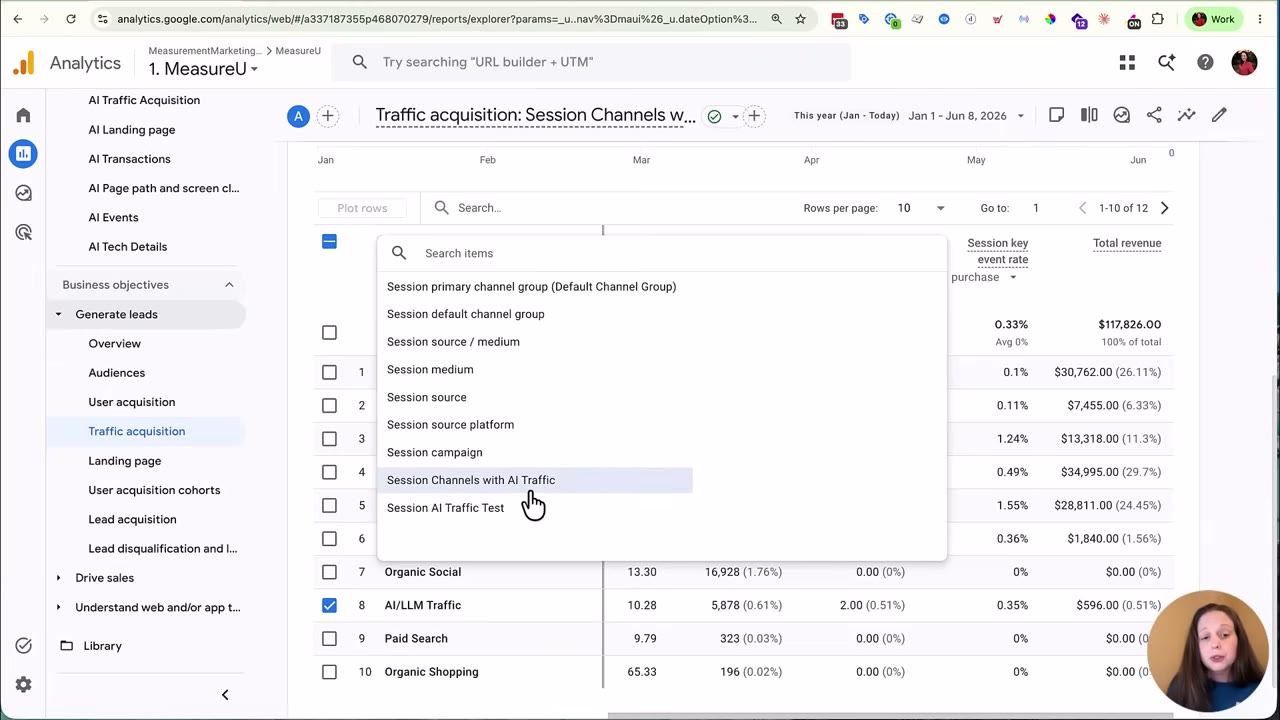
Head to Reports → Traffic Acquisition. By default, this shows your Default Channel Group. We left ours on default since we teach with it a lot, but you can switch to one of your custom channel groups using the dropdown.
Isolating Your AI Traffic
To see just your AI traffic:
- Uncheck the default grouping
- Check your AI/LLM channel group
- Click “Plot the rows” to get a trend chart
- Switch the view to Month instead of Day (this smooths out the daily noise and makes patterns easier to spot)
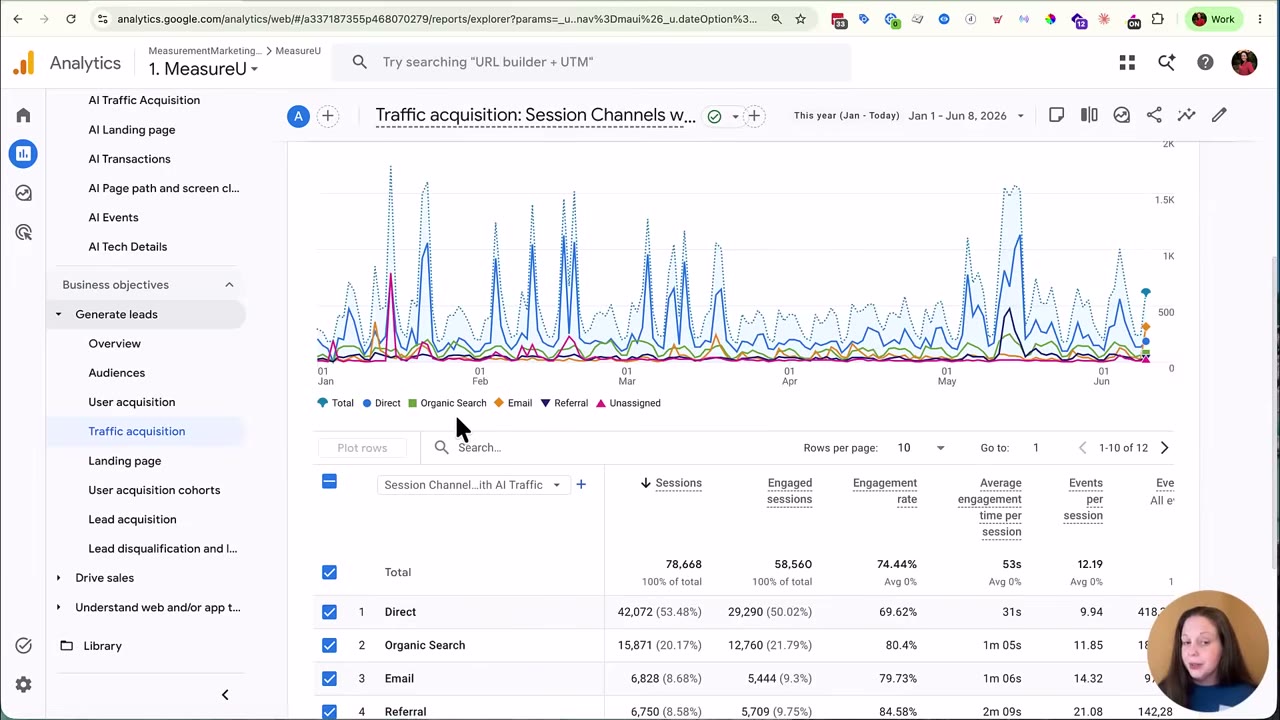
Looking at our own data: January and February trended up. April dipped. May increased again. June—as of the 8th, when I recorded this—looked low, but that’s just because the month had barely started. Context matters.
Checking Leads and Revenue
GA4’s built-in report actually shows revenue tied to AI traffic—that’s the good news. You can also check Key Events for things like Purchase and Generate Lead.
For our year-to-date numbers:
- ~572 total sessions from AI traffic
- ~10 leads from AI traffic
- 2 purchases attributed to AI sources
From here you can compare session conversion rates across traffic sources. How does AI stack up against Direct? Organic? Paid? That comparison tells you whether AI visitors are actually doing anything or just browsing.
Building an AI Traffic Dashboard in Data Studio (Client-Ready Template)
Let’s be honest—you probably don’t want to teach your client how to navigate GA4 directly. That’s a recipe for confused emails and “can you just show me” calls.
That’s where a Data Studio dashboard comes in. (Quick note: Google’s dashboard tool has been renamed a few times—most people still search for “Data Studio,” so that’s what I’ll call it here.)
Connecting Your Channel Group
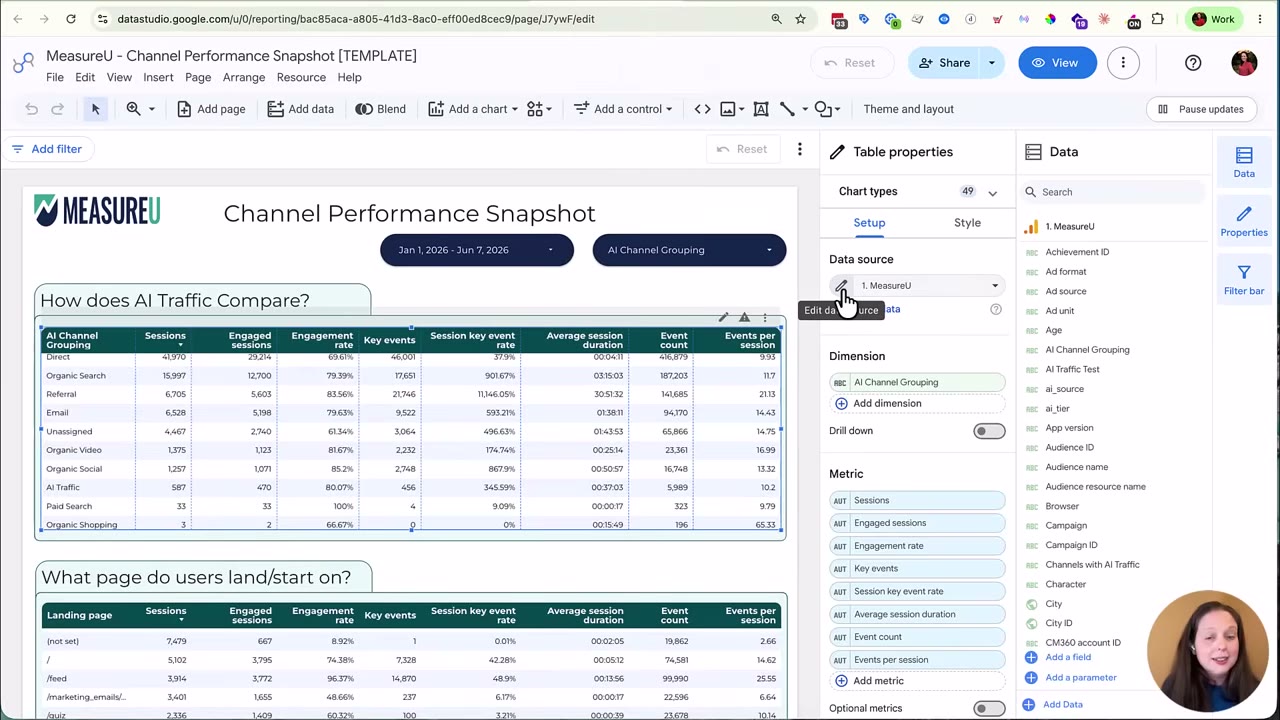
In Data Studio, connect your GA4 data source and search for the exact same channel group name you created in GA4. It’ll show up, and you can drop it straight into your table. Add metrics like Sessions and Engagement Rate the same way.
If you’re not familiar with Data Studio, we’ve got a template ready. It includes a filter for “AI Channel Grouping” so you can isolate AI traffic with one click.
What the Dashboard Answers
- What page do they land on? (Which blog posts or pages are getting AI traffic)
- What other pages do they view? (Second and third pages in their session)
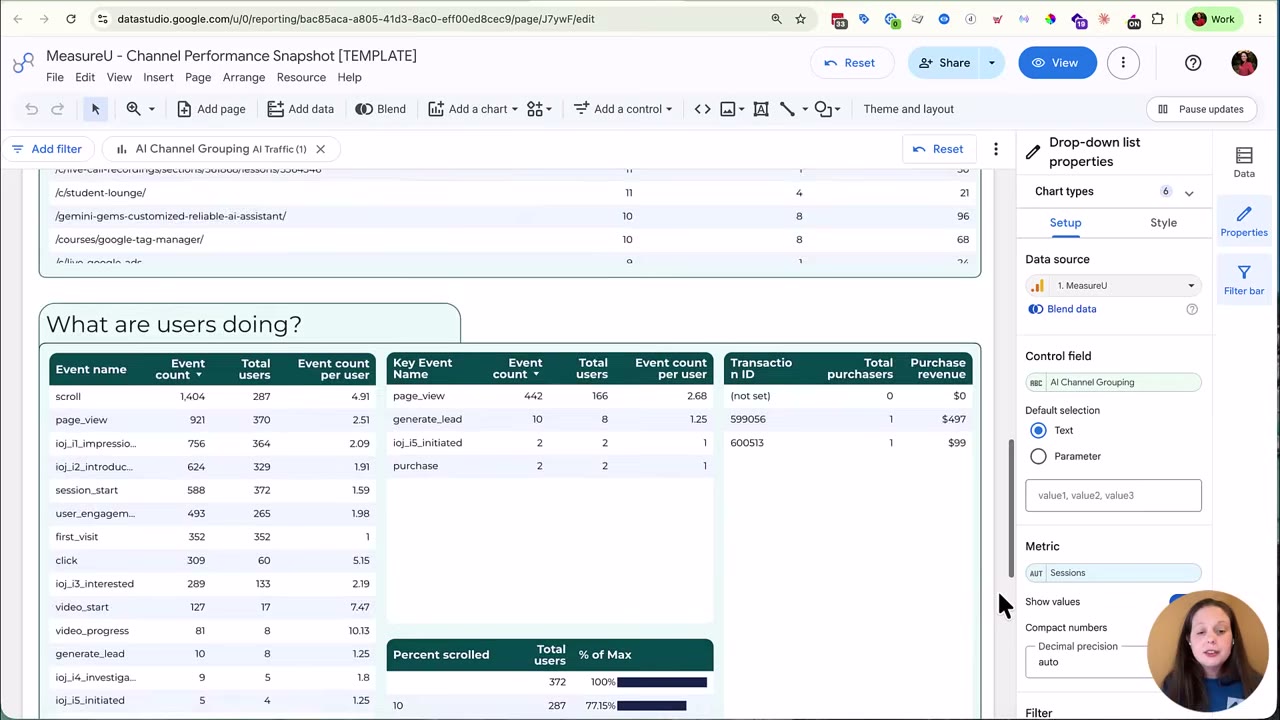
- What are they doing? (Key events and transactions tied to AI traffic)
- How far do they scroll? (If you have scroll tracking set up via GTM or custom code—10/25/50/75/90% thresholds)
Scroll Depth Example
Here's something interesting from our dashboard: only 15.32% of AI traffic scrolled to 90% on a page.
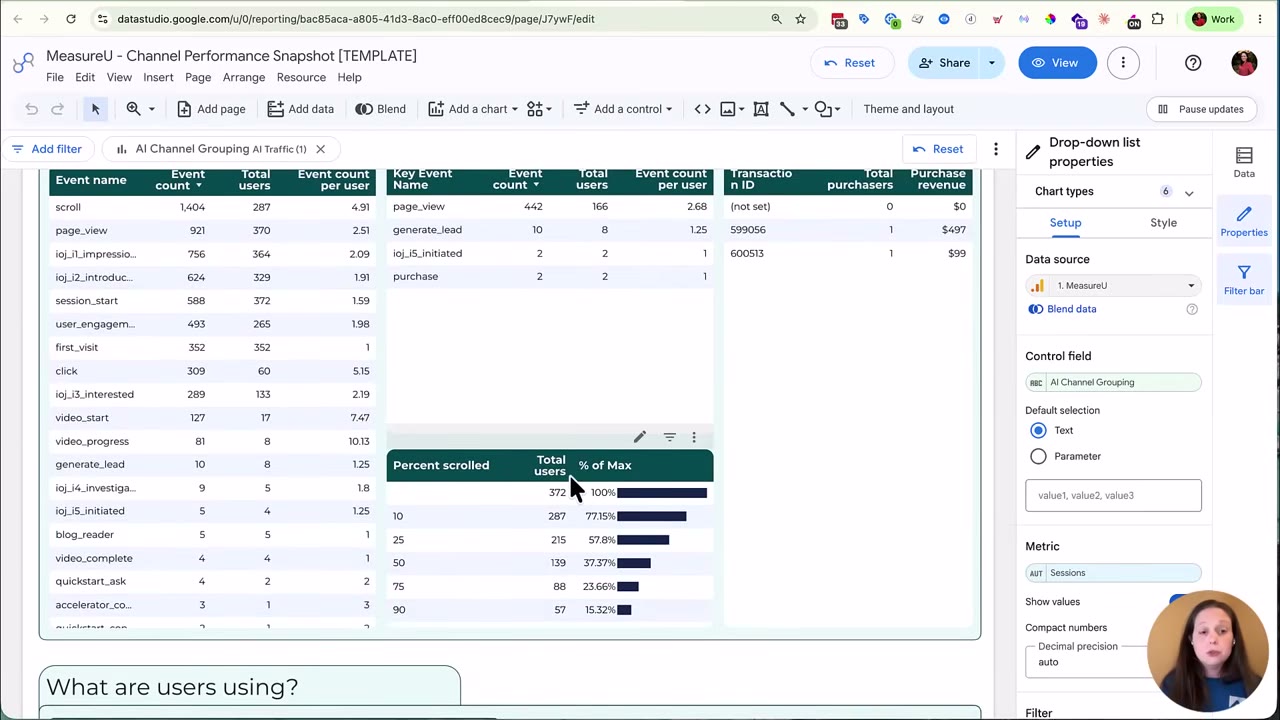
Why does that matter? Compare it to Direct traffic. If your CTA sits at the 90% mark of a sales page and AI visitors aren’t getting there, you’ve got a problem. Either move the CTA up or figure out why AI traffic bounces earlier.
Device Breakdown
We also track device type. For our audience, AI traffic was not predominantly mobile—same desktop-heavy pattern as our other traffic. Your results might differ. And if you do see a mobile skew from AI traffic, that’s a signal to prioritize mobile optimization and check your heatmaps more often.
Haven't Set Up the Channel Group Yet? Use This Case Statement Workaround
Okay, but what if:
- You haven't created your custom channel group yet
- You just created it and you're waiting on data to populate
- You've got a client meeting in 15 minutes and need answers now
- You only have view-only access (not admin)
Here’s the fix: a case statement.
How It Works
In Data Studio, go to your data source, add a field, and build a case statement that groups all the same AI traffic conditions (those 50+ values we talked about) into one bucket. Same logic as the channel group—just built as a calculated field instead of a GA4 setting.
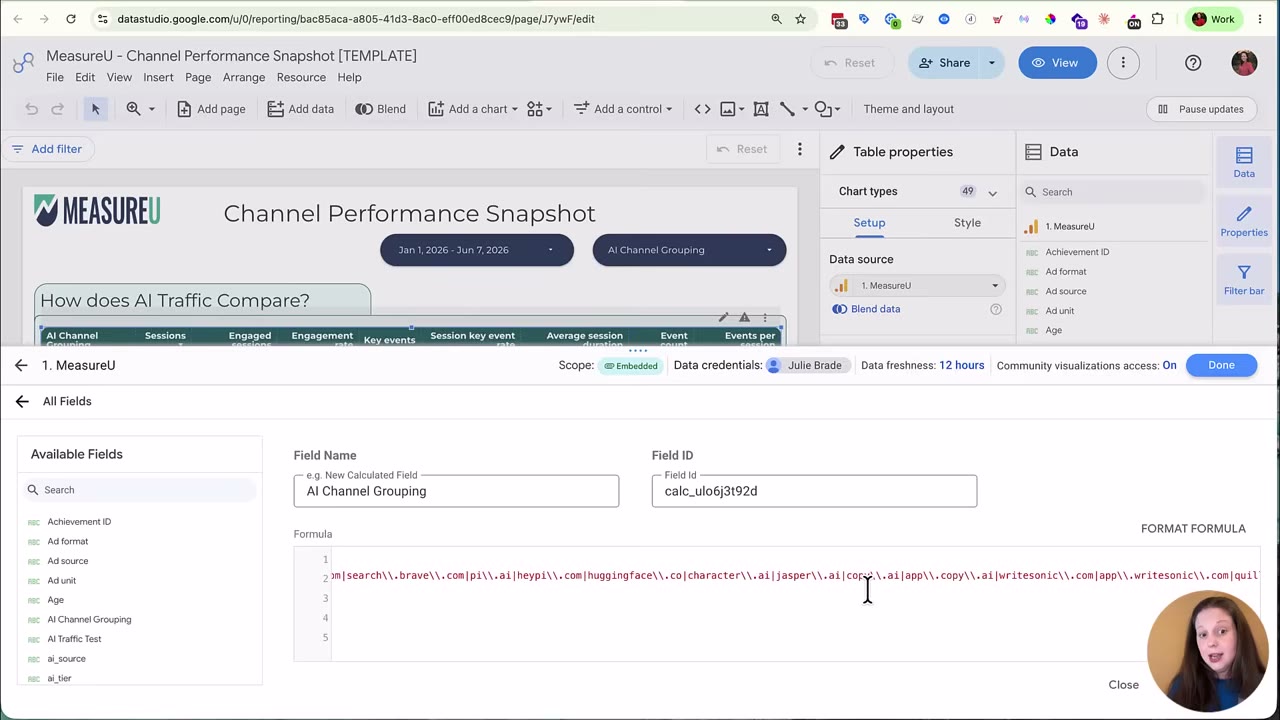
Important: Review your case statement carefully for your specific situation. Make sure you’re not accidentally grouping a legitimate domain—like an affiliate site with “chat” in the name—into your AI bucket.
Why We Built It This Way
When we taught this two months ago, using a custom channel group directly in Data Studio broke most metrics beyond basic views and sessions. The case statement approach fixed that.
The Big Advantage: Works With View-Only Access
You don’t need Admin access to use the case statement method. View access is enough. This means:
- You can build this dashboard even with limited permissions (common with enterprise clients or new accounts)
- It works great for prospecting: ask a prospect for read-only GA4 access, plug in the case statement, and show them what their AI traffic looks like before they’re even a client
That second point? That’s a game-changer for agency pitches.
Your Next Steps
- If you have the channel group set up: go check your Traffic Acquisition report right now. Look at the month-over-month trend. Are leads and revenue showing up?
- If you need a client-facing dashboard: build one in Data Studio using our template (details below).
- If you're stuck with view-only access: use the case statement method. It takes about 15 minutes to set up and works immediately.
Get Your Free AI Traffic Dashboard Template
Want the full template—including the complete case statement? (And trust me, it’s long. Those 50+ AI sources aren’t fun to type out by hand.)
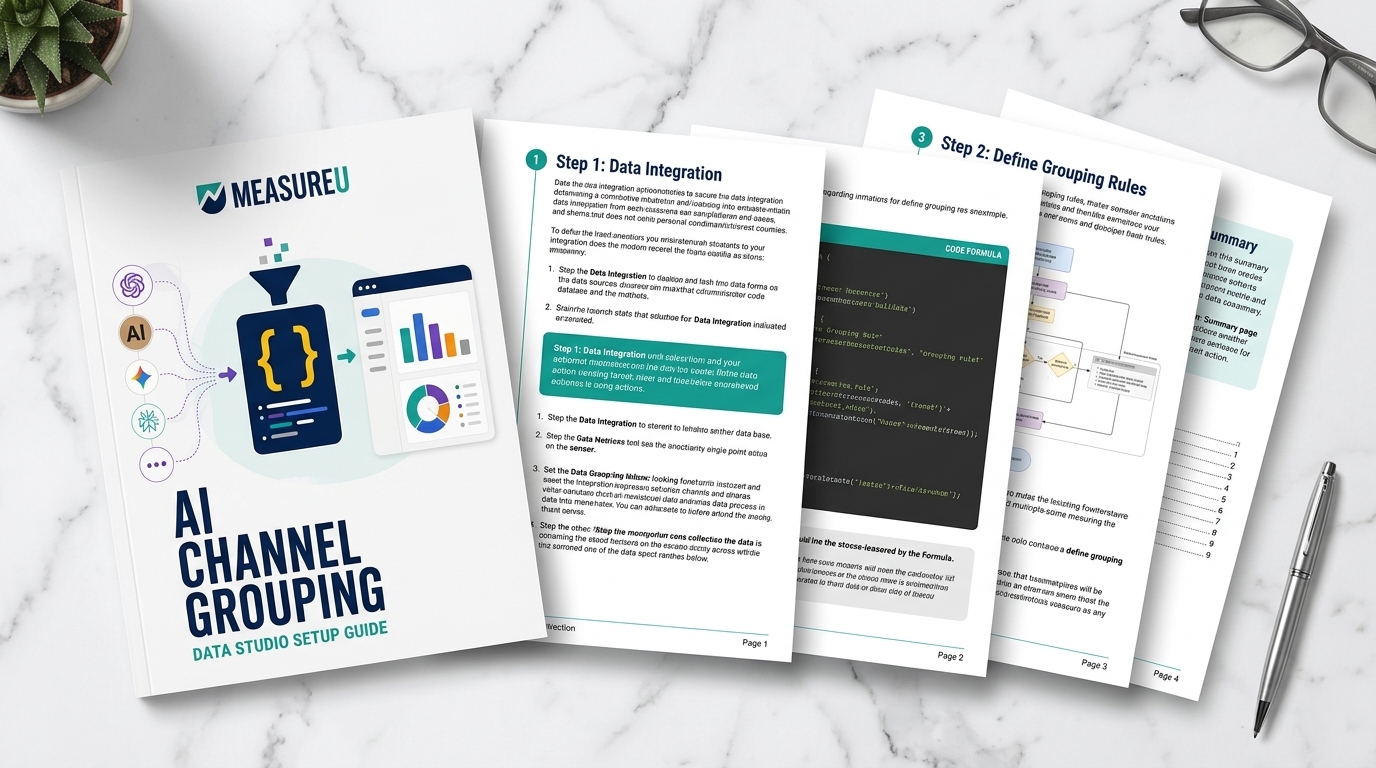
Grab the free AI Channel Grouping Setup Guide—it walks you through the custom channel group, the Data Studio dashboard, and the full case statement, ready to copy and paste.
And if you’re already inside MeasureU, reach out—we’re happy to help you work through this directly.
Note: AI tools were used to help create some of the images in this post.