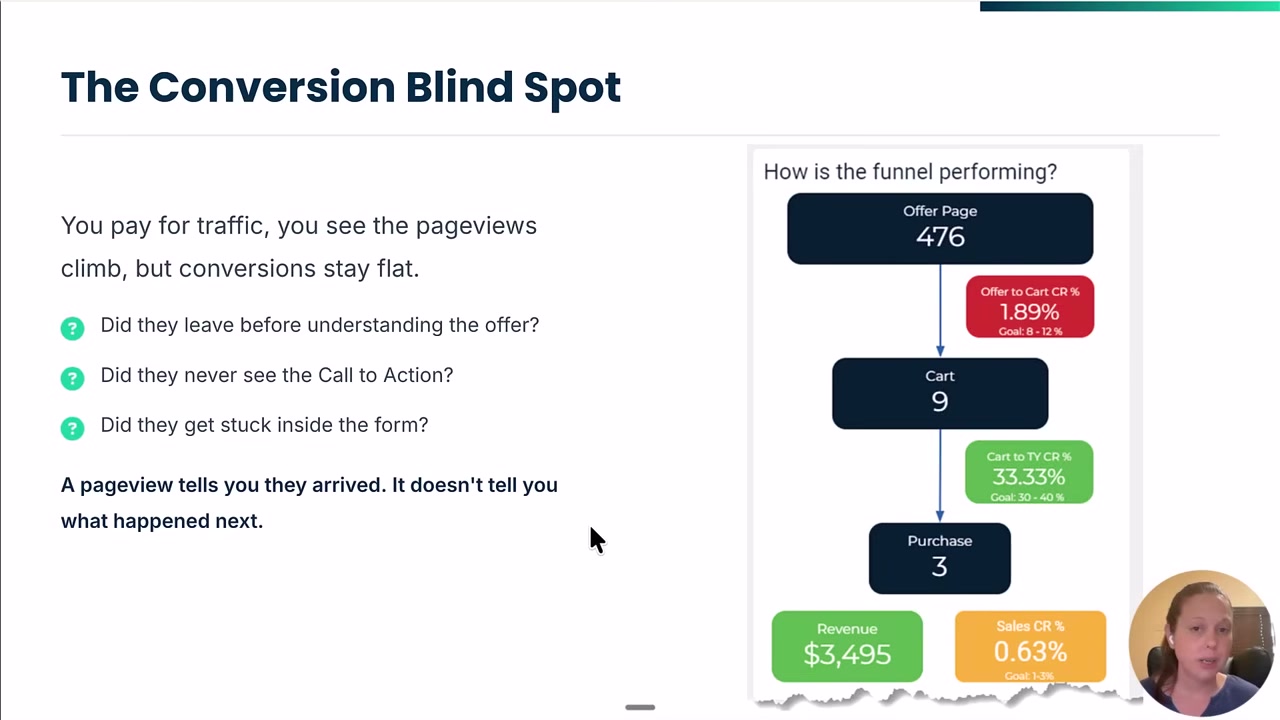
You're paying for traffic. The pageviews are climbing. And your conversions? Still flatlined.
Know that feeling? You're staring at a dashboard showing a 1% conversion rate from your offer page to cart, and everyone's telling you to change the headline. Or the CTA button color. Or maybe add more testimonials.
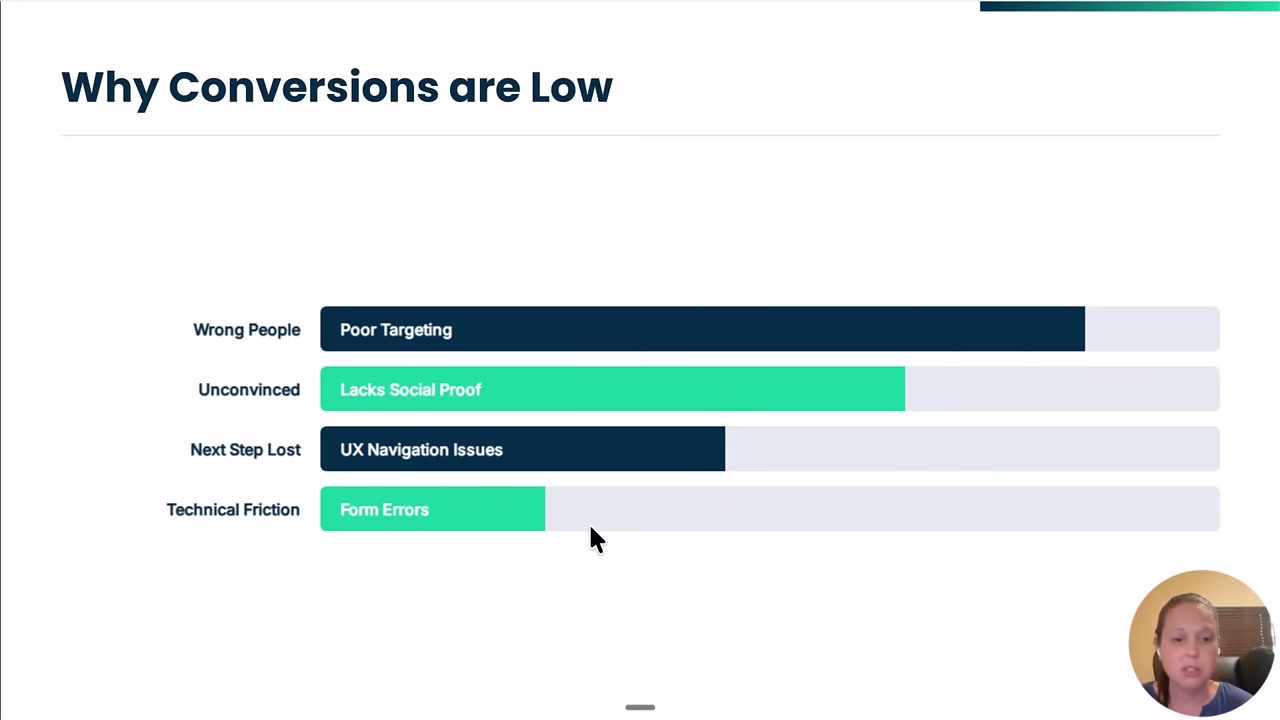
But here's the thing—you don't actually know what's broken. Did visitors leave before they understood your offer? Did they even see the call to action? Did they start filling out the form and then bail?
The pageview tells you they arrived. The conversion rate tells you they didn't convert. Neither one tells you why.
That's where behavioral signal tracking comes in. And in this post, I'm going to walk you through a simple 4-question diagnostic framework for landing page optimization that'll help you pinpoint exactly where your page is losing people—so you can stop guessing and start fixing.
Watch the Full Breakdown
Below, I'll break down the retail-store analogy, the connection gap, and the exact behavioral signals to track at each step of the journey.
What You'll Learn in This Post
- A pageview only tells you someone arrived—not what happened next
- Why AI and analytics can't distinguish between bounces, browsers, and abandoners (but you need to)
- The 4-question diagnostic framework that separates traffic problems from page problems
- How setting engagement signals beyond 10 seconds helps filter out bot traffic in GA4
Table of Contents
- Why AI Can't Tell the Difference Between a Bounce and an Abandonment
- When the Problem Isn't Your Landing Page
- 4 Questions to Diagnose Your Landing Page Performance
- What to Track (And What to Ignore)
- How to Audit Your Landing Pages Using Behavioral Signals
Why AI Can't Tell the Difference Between a Bounce and an Abandonment
Let me paint you a picture. Actually, let's use a retail store analogy because it makes this click faster.
Imagine three people walk into your physical store today:
Person 1: The Bouncer
Walks in. Looks around for maybe two seconds. Turns around and leaves. Gone.
Person 2: The Browser
Walks in, wanders up and down the aisles, maybe picks something up and puts it back down. Leaves without buying.
Person 3: The Abandoner
Walks in, tries things on, checks prices, reads labels carefully, puts items in their cart… and then walks out without purchasing.
Now here's the dangerous part.
Your analytics dashboard? AI tools? They see all three of these people exactly the same way:
- Pageview: Yes
- Conversion: No
That's it. No distinction whatsoever.
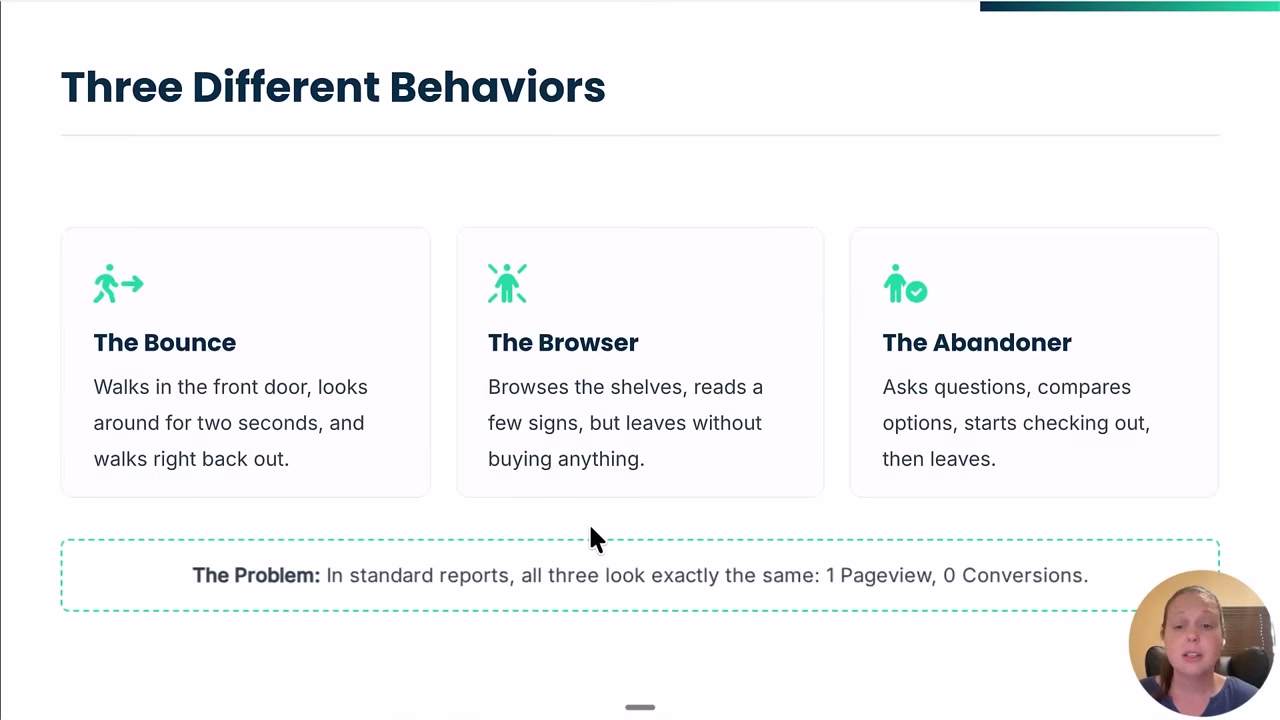
But you and I both know these are completely different situations. If you're running retargeting ads, you probably want to spend money going after that abandoner—they were this close to converting. You definitely don't want to waste budget retargeting the person who walked into a coffee shop thinking it was a gym. (More on that in a second.)
This is why user behavior tracking matters so much. Without those signals, you're making decisions blind. And if you feed AI tools data without context, they're going to give you garbage recommendations back.
Been there. Done that. Don't recommend it.
When the Problem Isn't Your Landing Page
So before you go tearing apart your sales page, let's talk about something that trips up a lot of people: the connection gap.
When you pay for traffic—whether that's ads, emails, whatever—the source creates an expectation. The ad promises something. The email teases something. And when someone clicks through, they're expecting that promise to be fulfilled.
If there's a disconnect between what was promised and what they find? They're gone.
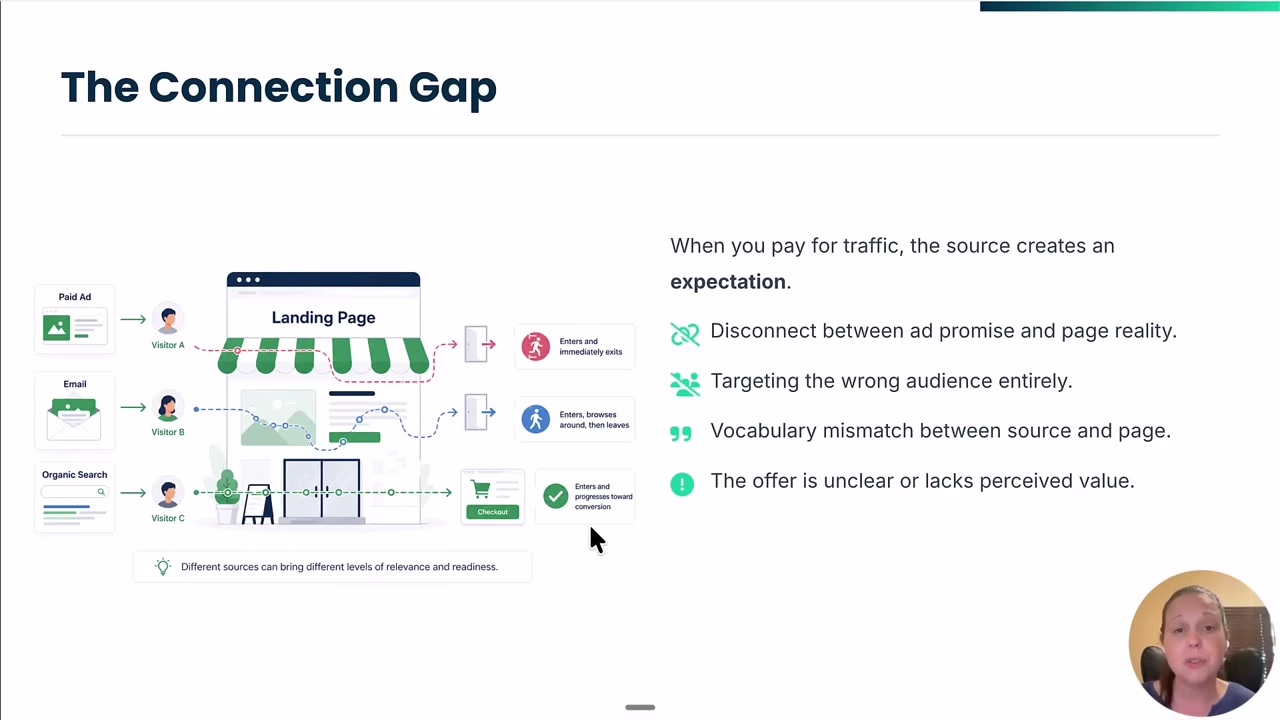
Here's my favorite example from the video:
Imagine your store is called “Your Daily Grind.” Cool name, right? Sounds like a coffee shop.
But what if someone sees that name and thinks it's a gym? They show up in workout gear, open the door, get a whiff of espresso, and immediately realize they're in the wrong place.
They bounced. But it wasn't your page's fault—it was a targeting and expectation mismatch.
This happens online all the time:
- Vocabulary mismatch between your ad copy and your landing page
- Wrong audience targeting that brings in people who were never going to convert
- Unclear offers that confuse people the moment they arrive
- Accidental clicks (if I'm scrolling Pinterest and accidentally tap an ad, I'm leaving immediately—sorry, that's not qualified traffic)
So step one in your conversion rate analysis isn't always “fix the page.” Sometimes it's “fix the traffic.”
4 Questions to Diagnose Your Landing Page Performance
Okay, now let's get into the diagnostic framework. These four questions will help you narrow down whether you have a traffic quality problem or a page experience problem.
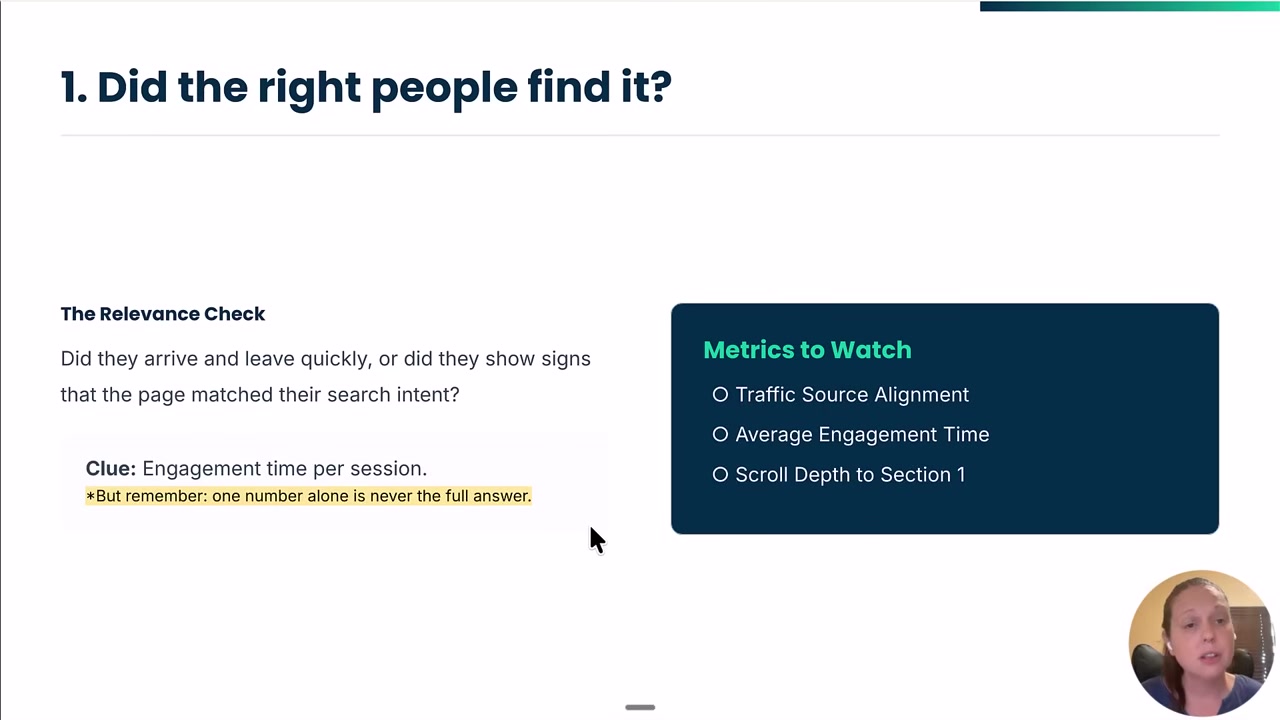
Question 1: Did the Right People Find It?
This is about arrival and initial engagement. You need signals that tell you:
- Did they arrive and immediately leave?
- Or did they show signs that the page matched their intent?
What to measure:
- Time on page
- Average engagement time (if your platform has it)
- Bounce rate
- Initial scroll depth
Pro tip on bounce rate in GA4: Here's something most people don't realize. Bots are smart now. Most bots stay on a page for about 10 seconds before leaving. So GA4's default engagement threshold? It's basically counting bots as engaged users.
My recommendation: set your engagement timers slightly beyond 10 seconds. Try 12 or 15 seconds. That way you're filtering out the automated traffic and getting a cleaner picture of actual human engagement.
(Unless the bots watch this video. Then they'll just adjust to 15 seconds and we'll keep playing this cat-and-mouse game forever.)
Question 2: Did They Engage With the Content?
So they didn't bounce immediately. Great. But did they actually do anything?
Signals to track:
- Scroll depth (10%, 25%, 50%, 75%, 90%)
- Video watch time (if you have a video sales letter)
- Clicks on any interactive elements
- Page-to-page navigation (did they explore?)
Quick note on scroll tracking: If you have a really long page, the standard 25-50-75-90 breakpoints might be too spread out. Consider going more granular—5%, 10%, 15%—so you can see exactly where people are dropping off.
Tools like Microsoft Clarity are fantastic for this kind of behavioral analysis. You can literally watch session recordings and see where people get stuck.
Question 3: Did They See the Next Step?
This one's huge. And it's where most people completely miss the diagnosis.
Let's say your conversion rate from sales page to cart is terrible. Everyone starts changing the CTA button, rewriting the pricing section, tweaking the headline.
But wait—did visitors even see the call to action?
If they're dropping off at 25% scroll and your CTA is at 75% scroll… you're fixing the wrong thing. The problem isn't your button. The problem is everything above it.
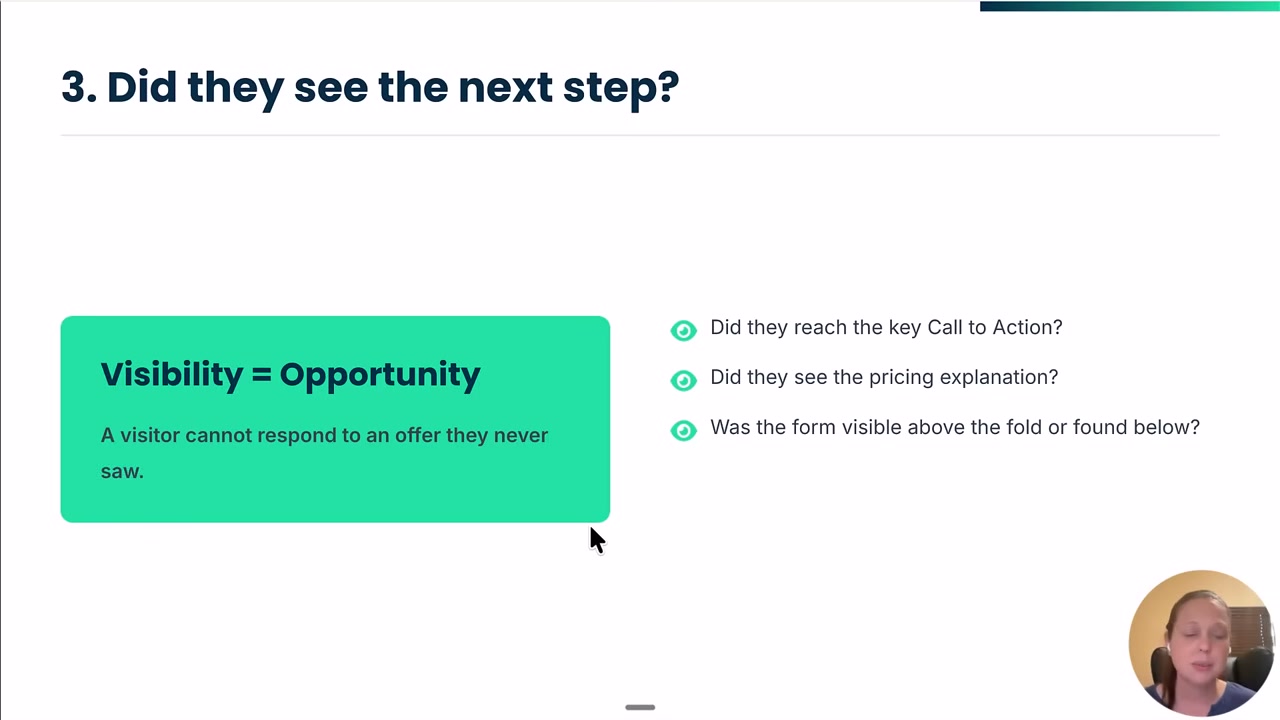
What to measure:
- Element visibility tracking (did the CTA enter the viewport?)
- Time spent viewing the CTA (a 3-second threshold is solid—it means they didn't just zoom past)
- Anchor point engagement
If you're using Google Tag Manager, you can set up triggers that fire when specific elements become visible for a set duration. This tells you whether people are actually seeing your most important conversion elements.
Question 4: Did They Move to the Outcome?
Finally—did they do the thing you wanted them to do?
What to track:
- CTA clicks
- Add to cart actions
- Form submissions
- Plan/option selections (if you have multiple tiers)
- Book a call button clicks
And here's a pro tip that'll reframe how you think about this:
The purpose of a sales page is NOT to get someone to purchase.
Read that again.
The purpose of a sales page is to get them to the cart. That's it. The cart has its own job—handling payment friction, applying coupons, confirming details. Don't make your sales page work harder than it needs to.
Same logic applies everywhere. A blog post's job might be to get an email signup—not to sell a course. A product page's job is add to cart—not checkout completion.
Each page has ONE job. Measure whether it's doing that job.
What to Track (And What to Ignore)
Let's face it—you could track every hover, every scroll pixel, every mouse movement. But too much data creates noise.
And here's the thing I've learned the hard way: if you give AI too much data without context, it's just going to spit out garbage analysis. Been there, done that, wasted hours.
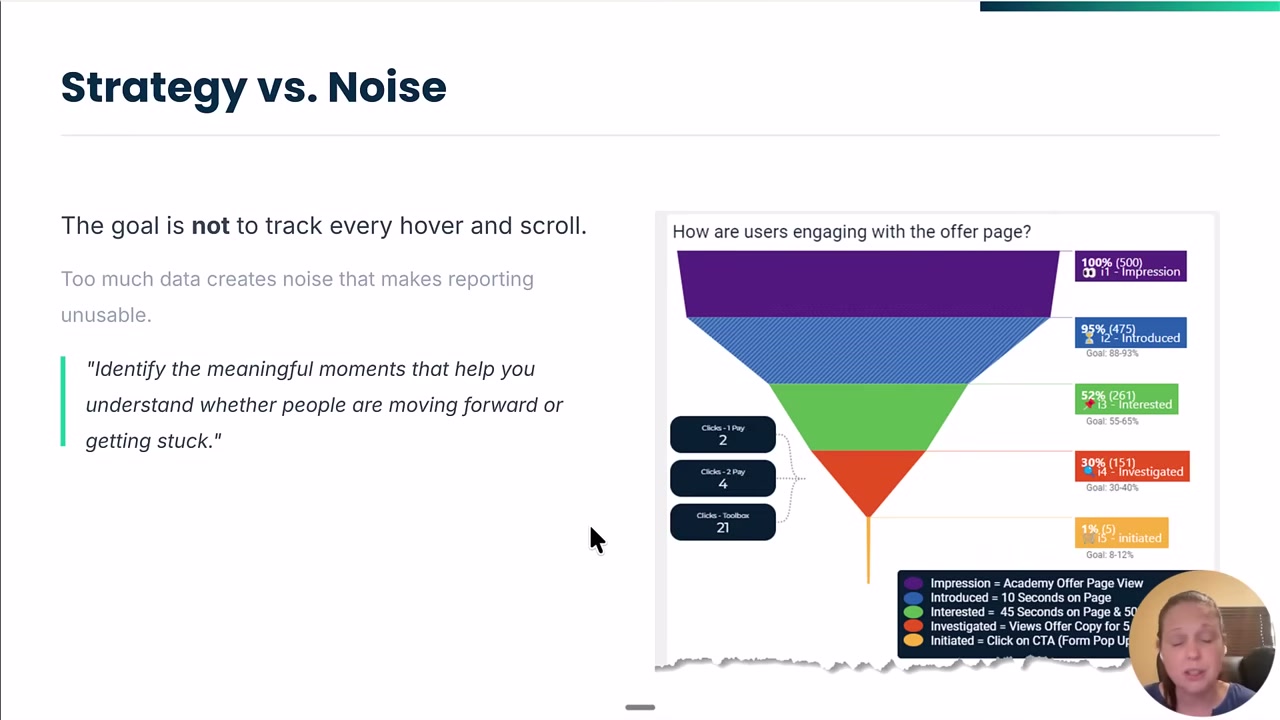
Focus on meaningful signals:
- Track: Scroll depth at key breakpoints, CTA visibility, engagement time thresholds, primary conversion actions
- Ignore: Every micro-interaction, hover states on non-critical elements, scroll tracking at 1% increments (overkill)
Think page-by-page:
For each page in your funnel, ask yourself:
- What is this page supposed to do?
- What must happen before that outcome can occur?
- What signals tell me those things happened?
Example: If you have a video sales letter where the buy button doesn't appear until 10 minutes in, and your data shows most people only watch 3 minutes… that's your signal. Either the traffic isn't right, or you need to shorten the video, or you need to move the CTA earlier.
Data tells you what to optimize. Without it, you're just throwing spaghetti at the wall.
How to Audit Your Landing Pages Using Behavioral Signals
Ready to actually do this? Here's your audit framework:
Step 1: Define the page's purpose
What is this single page supposed to accomplish? Be specific.
- Sales page → Get them to the cart
- Product page → Add to cart
- Blog post → Email signup or next article click
- Pricing page → Plan selection and checkout initiation
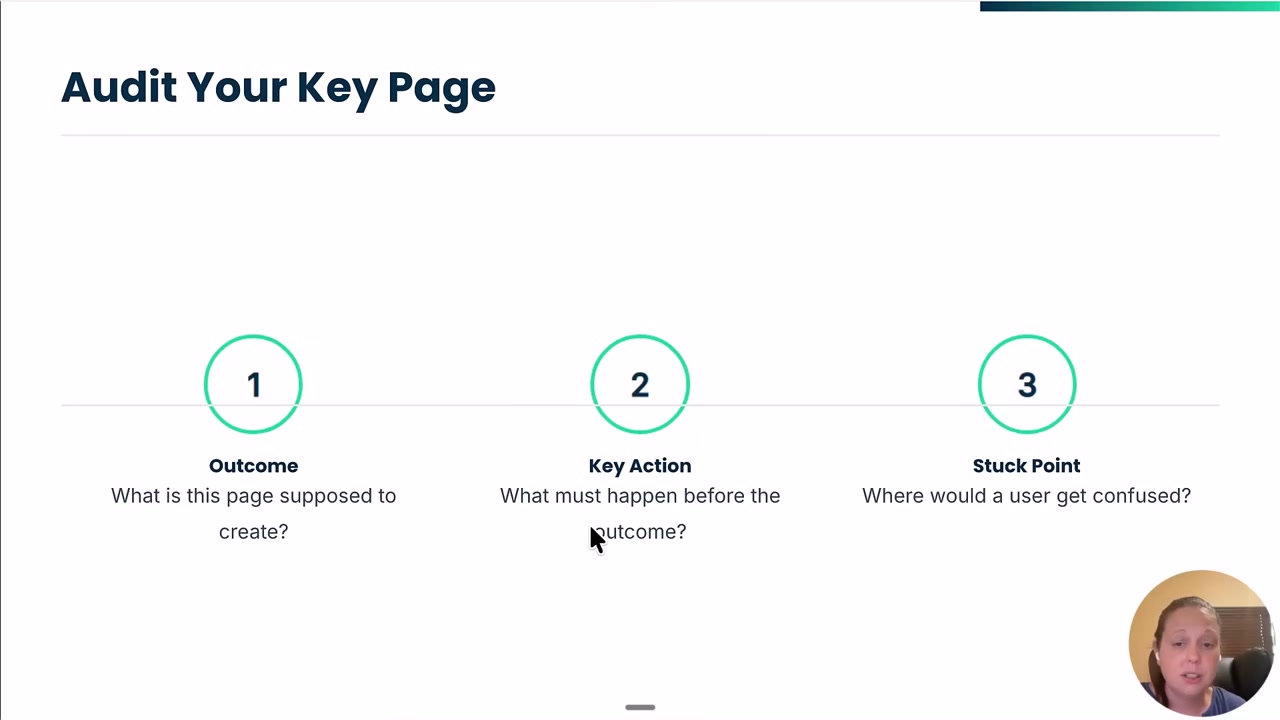
Step 2: Identify what must happen first
Before that outcome can occur, what behaviors need to happen?
- They need to scroll to see the offer
- They need to watch X minutes of video
- They need to click through a product gallery
- They need to see the CTA
Step 3: Set up signals for each step
For each required behavior, create a tracking event:
- Scroll depth triggers
- Video progress events
- Element visibility with duration thresholds
- Click events on key elements
Step 4: Analyze the drop-off points
Look at your data:
- 90% of visitors stay past 15 seconds? Good—right people are finding you.
- 70% scroll to 25% but only 20% reach 50%? Problem's in that middle section.
- CTA visibility is 30% but clicks are 5%? They're seeing it but not clicking—messaging problem.
- CTA visibility is 10%? They're not even getting there—fix everything above it.
Real example from the video:
A team was troubleshooting a 1% conversion rate from sales page to cart. Everyone wanted to change the CTA, the pricing table, the headline.
But the data showed: visitors stayed 15 seconds (engaged), scrolled to 10-25% (interested), but dropped off sharply before reaching 50%. Almost nobody saw the CTA.
The problem wasn't the CTA. It wasn't the headline. It wasn't the pricing. It was something in the middle of the page that was losing people.
That's incredibly specific. And it means you know exactly where to focus your optimization efforts instead of guessing.
Your Next Step
Here's what I'd do if I were you:
- Pick one landing page that's underperforming
- Run through the 4-question diagnostic framework
- Identify which signals you're currently missing
- Set up tracking for at least scroll depth and CTA visibility
- Give it a week of data, then analyze the drop-off points
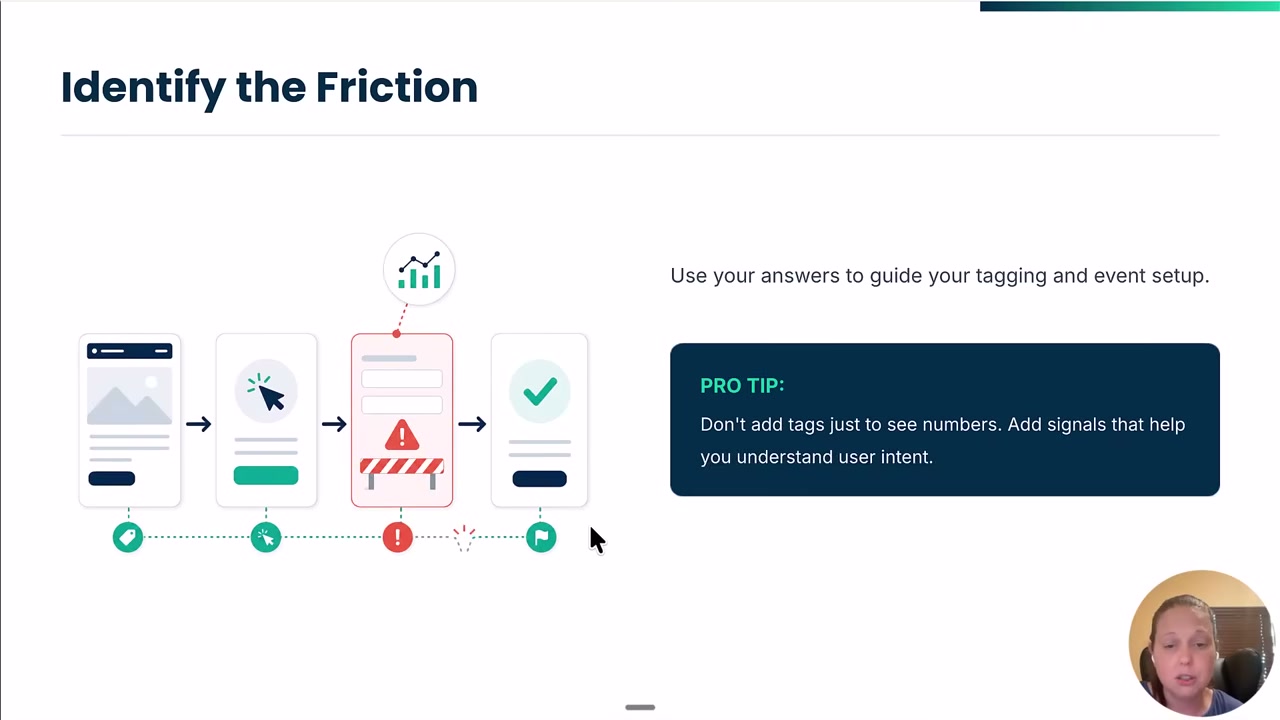
You'll be shocked how quickly the real problem becomes obvious once you have the right behavioral signals in place.
And when you do feed that data to AI tools? Now they'll actually have context to give you useful recommendations instead of generic “improve your headline” advice.
Scroll depth is where most of these diagnoses start—and it's the easiest signal to set up wrong. Grab our free GTM Scroll Tracking Guide and get accurate scroll-depth and CTA-visibility tracking live on your key pages in an afternoon.