Disclosure: This content was sponsored by thinkcell. All testing, opinions, and results represent my genuine experience using the product.
Know that feeling when you download a template, thinking it'll solve your problems, only to realize you still have to do all the actual work?
I've been on the receiving end of that disappointment for over a decade, as the person who created the template.
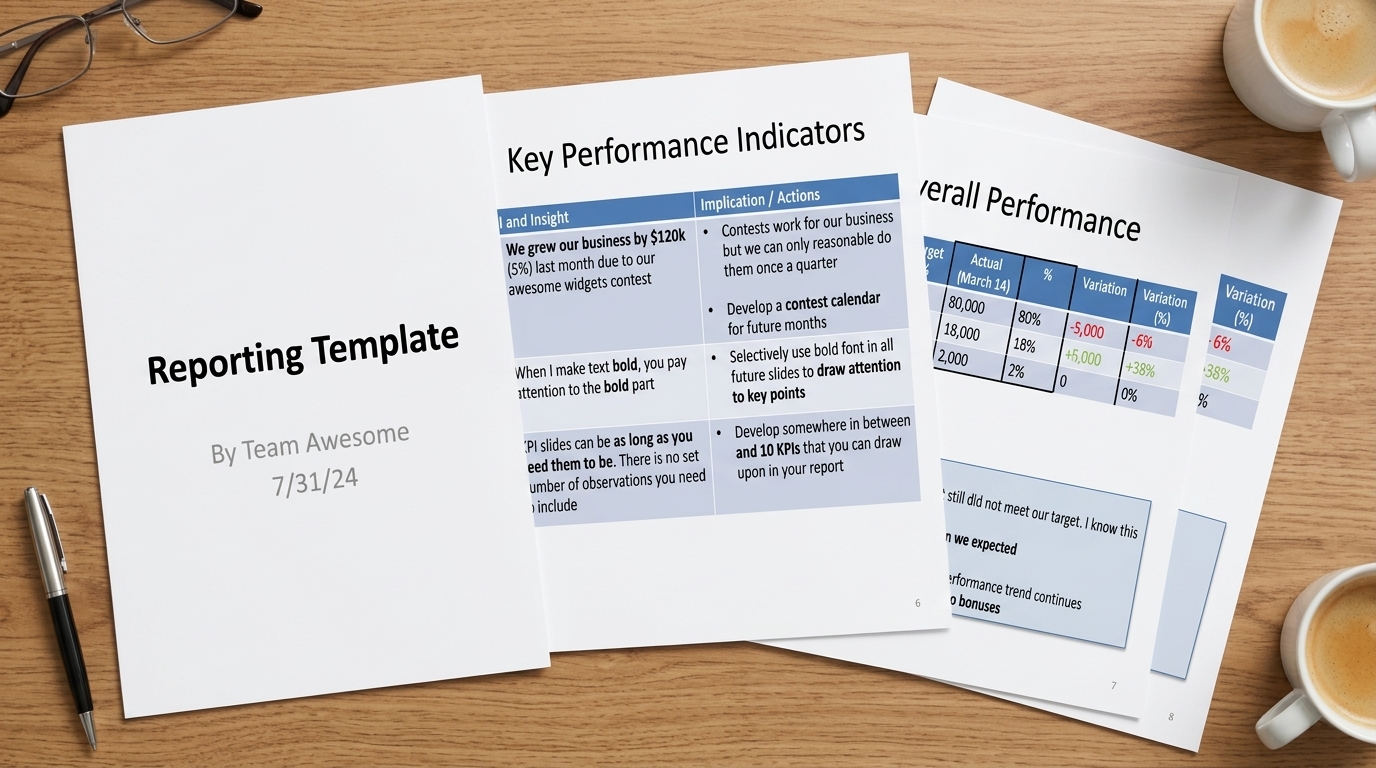
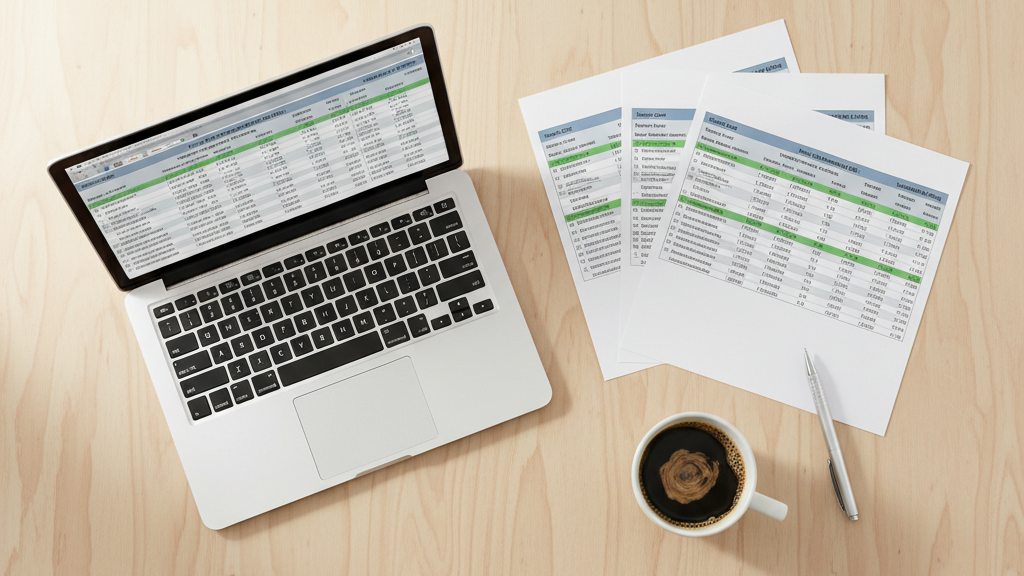
My monthly reporting template for marketers has been downloaded tens of thousands of times since 2014. Over a hundred thousand visitors to that page. It's one of the most popular pieces of content I've ever made.
And here's the thing: every single person who downloaded it still had to fill the whole thing out themselves. Every month. Every client. Every cell.
The structure was solid. The format did the thinking for you. But the template never solved the part everyone actually hates, getting the data into the presentation.
That's where thinkcell Assist comes in. I'm testing whether AI can finally take that job off your plate and populate a real reporting deck with real data, live.
Watch the Full Breakdown
Watch the full walkthrough here:
What You'll Learn in This Post
- thinkcell Assist modernized my decade-old template, recommended specific chart types, and built a complete KPI table from dictated input in minutes
- The tool links PowerPoint directly to Excel spreadsheets, so monthly updates become a refresh instead of a rebuild
- When the AI said it couldn't do something, pushing back with better context got the job done anyway
- Full automation from live data sources like Google Analytics or Meta Ads isn't available yet, you are still copying data into a sheet first
Table of Contents
- The Client Reporting Problem Every Agency Knows
- What thinkcell Assist Actually Does
- Installation: The One Mistake That Cost Me 5 Minutes
- Why Data Visualization Choice Matters in Monthly Reports
- Modernizing a Decade-Old Template in Real Time
- Building the KPI Table: Voice-to-Chart in Minutes
- When AI Pushes Back (And How to Push Back Harder)
- The Monthly Refresh: Linking Excel for Ongoing Updates
- The Executive Summary: The Slide That Usually Takes Hours
- Honest Verdict: What Works, What Doesn't, Who This Is For
The Client Reporting Problem Every Agency Knows
I've been in digital marketing for over twenty years. For most of that time, client reporting was a core part of the job.
Running an agency means building decks every single month. Pulling numbers together. Making them look coherent. Telling a story a client actually understands.
Back in 2014, I shared a template to systematize that process. It included:
- A title slide
- Sections for your agenda
- Executive summary
- KPI table
- Overall performance
- Supporting evidence
- An appendix
I put it on my site, wrote a blog post, and kind of forgot about it. Then people kept finding it. And sharing it. And asking me the finer points of using it.
The structure does the thinking for you when it comes to what sections you need and in what order.
But the template never solved the part everyone actually hates, tedious data entry. Time-consuming. The kind of work that either doesn't get billed or doesn't get done well because nobody wants to sit there doing it.
What thinkcell Assist Actually Does
thinkcell Assist is an AI assistant that lives inside both PowerPoint and Excel. You build charts, create tables, and update data by telling it what you want through a chat interface.
It sits on top of thinkcell's chart library, a deep catalogue of chart types that's been used for professional presentations for years. Waterfalls, Mekko charts, and options well beyond what native PowerPoint offers.
The AI layer is what makes it worth talking about here. The chart library is the foundation it builds on.
Installation: The One Mistake That Cost Me 5 Minutes
Installation was super easy on my Mac. You download and install with a free trial.
Of course, I made one mistake that cost me about five minutes.
When the install wizard asked for access to other apps (i.e., PowerPoint), I didn't allow it. Then I wondered why the ribbon tab wasn't showing up when I launched.
So if you want this product to work:
- Grant it permission to work with PowerPoint
- Enter the license key from your confirmation email
- The tab appears
If you hit that same wall, that's the fix.

Why Data Visualization Choice Matters in Monthly Reports
After reviewing my slides, Assist told me which charts to replace and with what. Not just “consider a better chart”, specific chart recommendations with reasons attached.
Here's what it suggested:
- Overall performance slide: Recommended a Mekko chart or stacked bar instead of the generic pie chart I had
- KPI trends: Suggested a line or bar chart
- Supporting evidence: Recommended a waterfall chart to show what actually drove the change
Agency owners and consultants know this problem. You have data, you need a chart, and you pick the one that feels right without always knowing whether it's actually the right choice.
Having the tool make a data visualization recommendation with reasoning attached is genuinely useful. It's not just generating charts, it is advising on which visualization best tells your story.

Modernizing a Decade-Old Template in Real Time
My original template was generic. Four-by-three ratio. Black-and-white. Full of placeholder data, including a made-up example about growing a business by $120,000 with a “widgets contest.”
I asked Assist to modernize it:
- Convert to widescreen
- Update the fonts and text colors
- Match the color scheme to my current brand
It told me it could update text colors and rewrite body copy, but it couldn't touch background colors or the slide master, those require you to go into the master view yourself.
The AI Assist is very clear about its limitations, which I respected. Most other AI tools tend to be overconfident but under-deliver.
I went into the slide master manually, set the primary accent color, and came back two minutes later. While I was doing that, Assist handled the text formatting updates across the deck.
The copy got tightened. The fonts updated. Not a full professional redesign, but meaningfully better than what I started with. And it took a fraction of the time it would have taken me slide by slide.

Building the KPI Table: Voice-to-Chart in Minutes
This is the part of the demo I was most curious about.
The KPI table in the original template is a two-column matrix, metric on one side, insight and implication on the other. Filling that out is the most tedious part of the whole job.
Here's how it went:
Step 1: I told Assist I wanted to update the table
Step 2: It quizzed me for the most important KPIs
Step 3: I told it: revenue, conversion rate, customer acquisition cost, and return on ad spend
Step 4: I entered example figures into the Assist chat, a revenue figure, a conversion rate, an acquisition cost, a ROAS number, along with targets for each one. Round demo numbers to test the tool.
Step 5: It understood all of it
It built the table, filled in the cells with the numbers I gave it, created the charts, and applied the brand formatting we had set up earlier.
My honest reaction watching it happen: this eliminated a lot of the busywork that's usually super time-consuming to do.
The table came back filled in, with formatting to show how we were tracking compared to our KPI targets. Such a time saver.

When AI Pushes Back (And How to Push Back Harder)
Now, I want to show you something that didn't go smoothly, because I think it's more useful than a perfect demo.
I asked Assist to take the data I had pasted into Excel and use it to rebuild the narrative table on the slide.
It told me it couldn't do that.
I pushed back. I said: “You just created a new data table for me a minute ago, don't tell me that you can't do it. You literally created the KPI and Insight table. Just create a new slide the same way.”
And it did.
It built a new table from the spreadsheet data, applied the formatting, and put it in the deck.
The lesson here? Sometimes you need to pull rank with AI tools and help them refresh their memory. Give them new context they may have forgotten. When I reframed it, the tool delivered.
This is actually a broadly applicable skill when working with any AI assistant, not just thinkcell.

The Monthly Refresh: Linking Excel for Ongoing Updates
This is the part that determines whether the tool saves you time once, or saves you time every month.
Say your data lives in an Excel spreadsheet. It's structured with months as columns and KPIs as rows. Targets stay fixed. You update the actual numbers manually each month.
But what about updating your charts? Can that be done automatically?
Yes.
With Assist, I linked the data easily. It noted where the numbers were coming from, so anyone opening the file can see the data is connected to a source, not just typed into a slide.
And the brand formatting carried through because, in my own words, “it has my branding in place because we taught it that.”
The charts in PowerPoint stay linked to that Excel spreadsheet for all future months of marketing analytics reporting.
Next month:
- Update the numbers in the sheet
- Tell Assist to refresh the slide
- It updates every cell
The structure is sound: data in one place, presentation linked to it, monthly update is a refresh, not a rebuild.
Saves a ton of time.

The Executive Summary: The Slide That Usually Takes Hours
From my monthly reporting template, I always recommend that the executive summary is the last slide you build, even though you place it at the beginning.
It's the most important slide in your entire reporting presentation. You build the whole deck, you know what the story is, and then you write the summary.
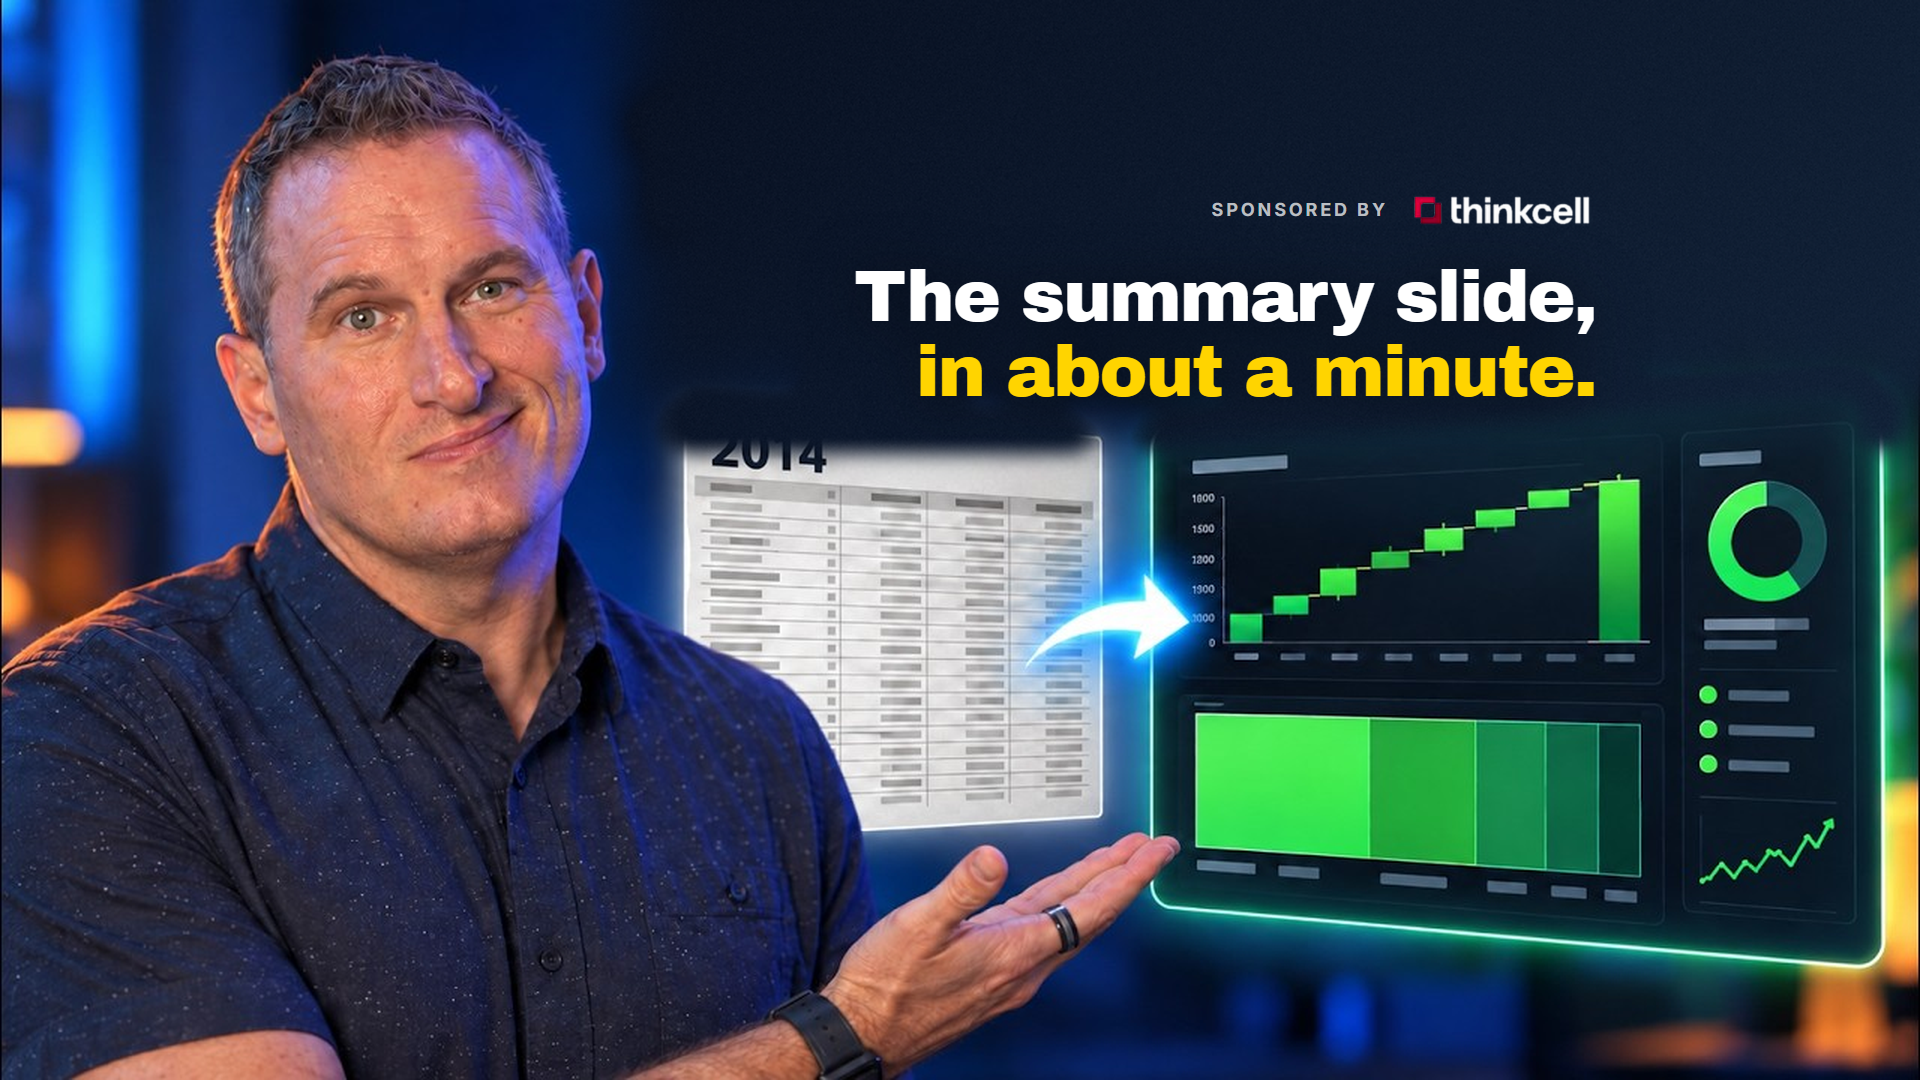
So at the end of my trial, with everything else in place, I asked Assist to generate the executive summary slide.
It offered me a choice of slide style first, which I appreciated. Then it generated the slide and inserted it.
At first I was confused, thinking it was just inserting a generic PowerPoint-style slide and forcing me to fill it out.
But I could see the Assist feature was still working. About a minute later, I had a gorgeous executive summary slide that was well-thought out and genuinely useful.
It was telling me our targets and how we were performing against them.
The executive summary is what usually takes hours to come up with.
Assist did it in about a minute.

Honest Verdict: What Works, What Doesn't, Who This Is For
thinkcell not only did what I needed it to do, it really impressed me along the way.
What worked:
- Modernized a decade-old template
- Advised me on chart choices with actual reasoning
- Built a KPI table from dictated input
- Matched brand colors automatically
- Linked the deck to a spreadsheet for monthly refresh
- Generated an executive summary with a narrative from the actual data
What I still had to do manually:
- Slide master and background color updates
- Some formatting tweaks
Honest limitations to know about:
- Full automation from live data sources like Google Analytics or Meta Ads isn't there yet. You're still copying data into a sheet and telling it to refresh, not connecting directly to your analytics platform.
- Occasionally it will tell you it can't do something that it actually can do if you push the request differently.
None of those limits are dealbreakers for me. But you should know they exist before you build your workflow around it.
Who Is This Actually For?
Anyone who dreads monthly reporting and doesn't like the inconsistent results they get using a general-purpose AI tool or manual interaction.
thinkcell charts are much better than what you can create on your own. They understand data and repeatable use, so you can update your report every month without the hassle.
Your reporting will look good and look on brand if you take the time to set it up.
I'm confident anyone can fill out my monthly reporting template using thinkcell Assist and get it exactly how I intended, without making a lot of sacrifices, and without spending nearly as much time as you would doing this manually.
Frequently Asked Questions
Can thinkcell Assist pull data directly from Google Analytics or ad platforms?
Not yet. You're still copying data into Excel and then linking that to your presentation. Direct integrations with analytics platforms aren't available at the time of this test.
Does it work on Mac?
Yes. I ran this entire test on my Mac. Installation was straightforward, just make sure you grant the necessary permissions when prompted.
What if it says it can't do something I know it should be able to do?
Push back. Reframe your request. Give it context about what it just did. In my test, this approach worked when the tool initially declined a request it was actually capable of completing.
Is this worth it for someone who only has a few clients?
If you dread reporting at the end of every month, yes. The time savings compound, and the quality improvement is noticeable even with a small number of reports.
Your Next Steps
Here's what to do now:
- Download my original monthly reporting template if you haven't already, it is still the perfect resource for any marketer who dreads “reporting season” at the end of each month
- Try thinkcell Assist for yourself with the free trial, linked at the end of this post
- Set up your brand colors and template first before trying to generate content, this ensures everything that follows looks consistent
Try It Yourself
My original template is still available and still as useful as ever for structuring your reports.
If you want to try thinkcell Assist for yourself, there's a free trial available.
Try It Yourself
My original monthly reporting template is still free, and still the fastest way to structure a report your client will actually read.
If you want the AI half of this, thinkcell Assist has a free trial, so you can run it against your own deck before you commit.
And if you would rather have the whole measurement system behind the report, MeasureU Pro is where we teach it.