Know that feeling when a tool you've invested years mastering suddenly feels like it's working against you?
Siavash Kanani taught over a thousand students how to build reports in Data Studio. He ran masterclass cohorts for five years straight. And this year? He stopped. Not because he lost interest in teaching, but because he no longer believes in where the tool is going.
That's a pretty bold statement from someone who literally built a business around it.
Here's the thing: Google just renamed Looker Studio back to Data Studio. Again. And when Google itself can't decide what a product is supposed to be, that tells you something about its strategic priority (or lack thereof).
Siavash laid out his entire reasoning at MeasureSummit, walking through what he calls “the boring 80%”, the unsexy production work that turns a weekend prototype into something you can actually stake your reputation on.
Watch Siavash Break It All Down
Check out the full presentation from MeasureSummit where Siavash walks through his decision to stop teaching Data Studio and shows live demos of the custom applications he built instead:
What You'll Learn in This Post
- Google's repositioning of Data Studio as a “personal data exploration tool” signals a retreat from professional/agency use cases
- The jump from prototype to production app took months, not the days you see on LinkedIn
- Custom apps built with AI assistance can now do things that were never possible in Data Studio (comparison date ranges, API triggers, adaptive reporting)
- The “boring 80%” includes authentication, security, testing, and schema migration, stuff nobody talks about
Table of Contents
- The Name Change Chaos: What Google's Confusion Signals
- The Ceiling: What Data Studio Was Never Built to Do
- The Workaround Years: Building Products on Top of Limitations
- The Breaking Point: When 9 of 10 Features Aren't Possible
- The Boring 80%: What It Actually Takes to Go Production
- What You Can Build Without the Ceiling
- Should You Make the Switch?
The Name Change Chaos: What Google's Confusion Signals
Let me walk you through the timeline because it's actually kind of wild:
- Original: Google launches Data Studio as a free dashboard builder for Google tools
- Expansion: Partner connectors arrive, suddenly you can pull in Facebook Ads, Bing, anything with an API
- Rebrand: Google renames it Looker Studio, positioning it as part of the enterprise Looker BI suite
- Split: We get Looker Studio (free), Looker Studio Pro (teams), and Looker within the broader Looker ecosystem
- April 2026: Google renames it back to Data Studio
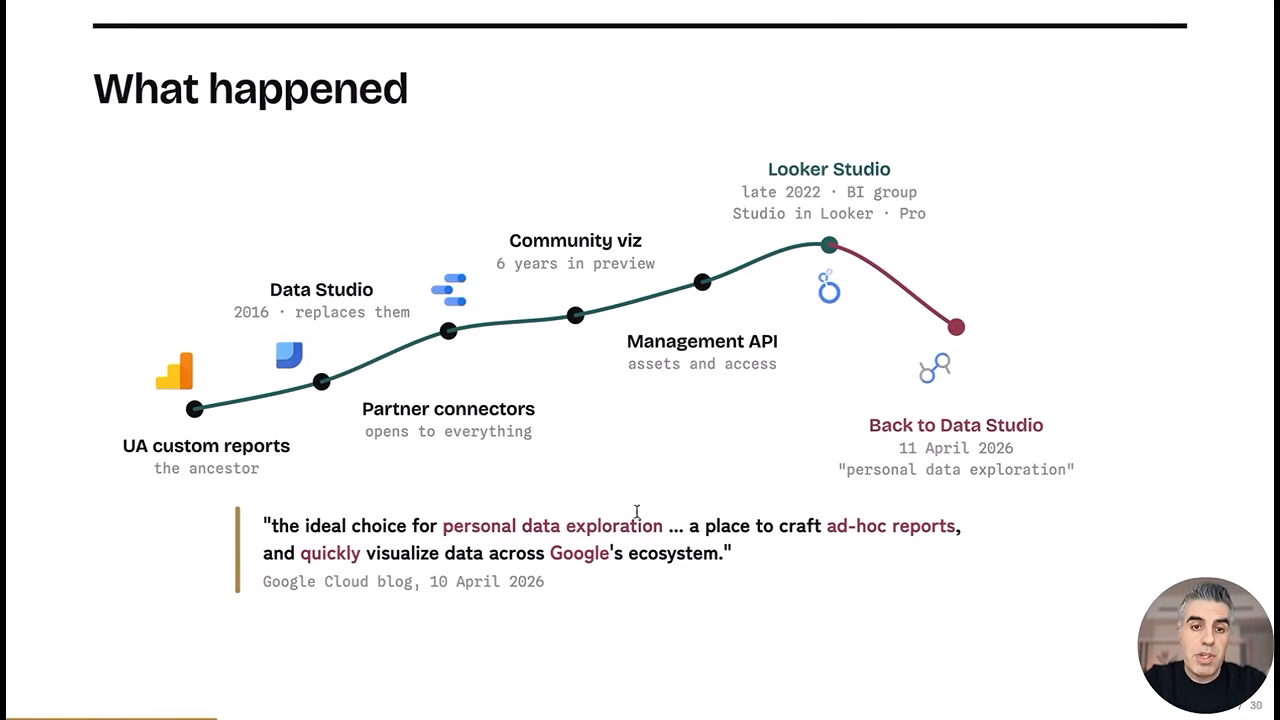
And here's the quote directly from Google's documentation that should make any agency nervous:
“The ideal choice for personal data exploration… a place to craft ad hoc reports and quickly visualize data across Google's ecosystem.”
Personal. Ad hoc. Google's ecosystem.
Not “agency reporting.” Not “client dashboards.” Not “custom data visualization tools for businesses.”
Meanwhile, Google Analytics 4 is building its own native dashboarding features, essentially working around the very tool that was supposed to be GA's visualization layer.
So where does that leave the tool? Siavash put it bluntly: “I don't know the direction of Data Studio anymore.”
The Ceiling: What Data Studio Was Never Built to Do
Let's be honest about what Data Studio always was:
What it did well:
- Free (huge deal)
- Fast connections to GA, BigQuery, Google Sheets
- Beautiful, interactive visualizations
- One of the best tools available for many teams
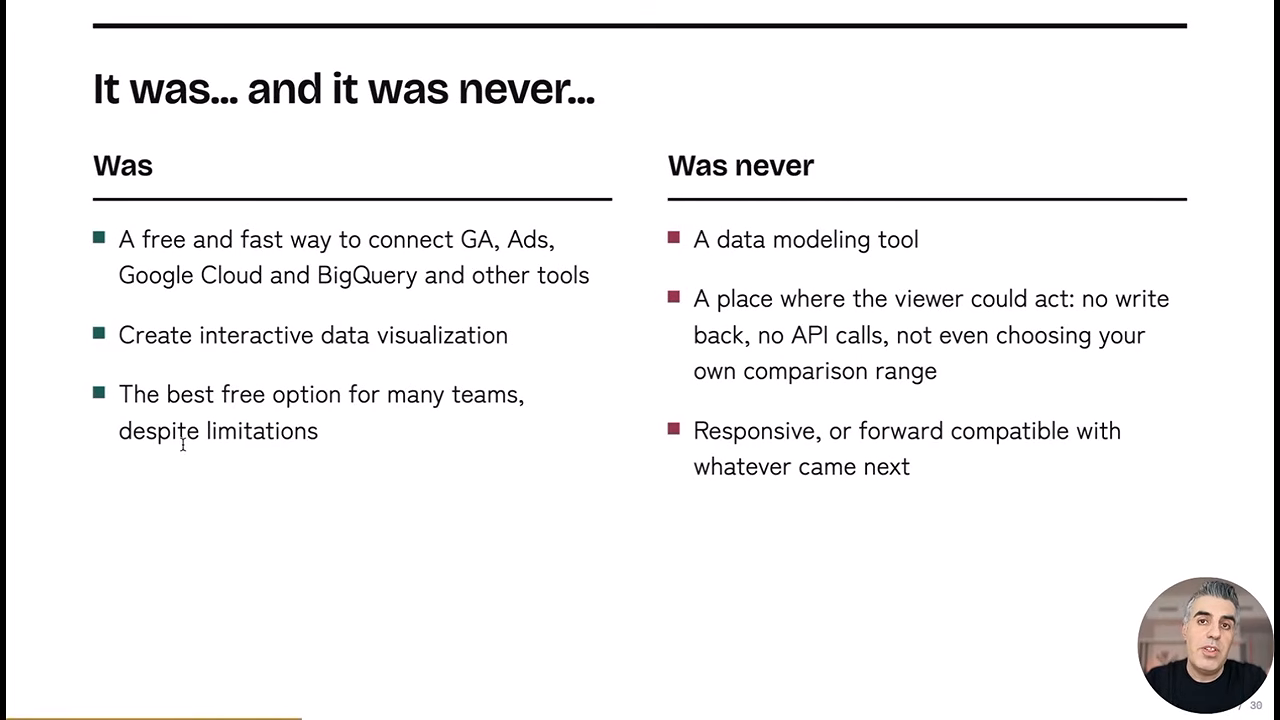
What it was never designed for:
- Data modeling: It's a visualization layer, not a transformation tool
- Data blending beyond 5 sources: Hit that limit constantly
- Viewer interactivity: Your client can't change their own comparison date range (still not possible)
- API access: No programmatic management of reports or components
- Triggers: Reports can't write back or send actions to other tools
- Responsive design: The “responsive” feature they eventually added? Siavash never ended up using it for client reports because it introduced more limitations
And here's the kicker: community visualizations, the feature that let developers create custom chart types, has been in “developer preview” for six years. Still in preview. Six years.
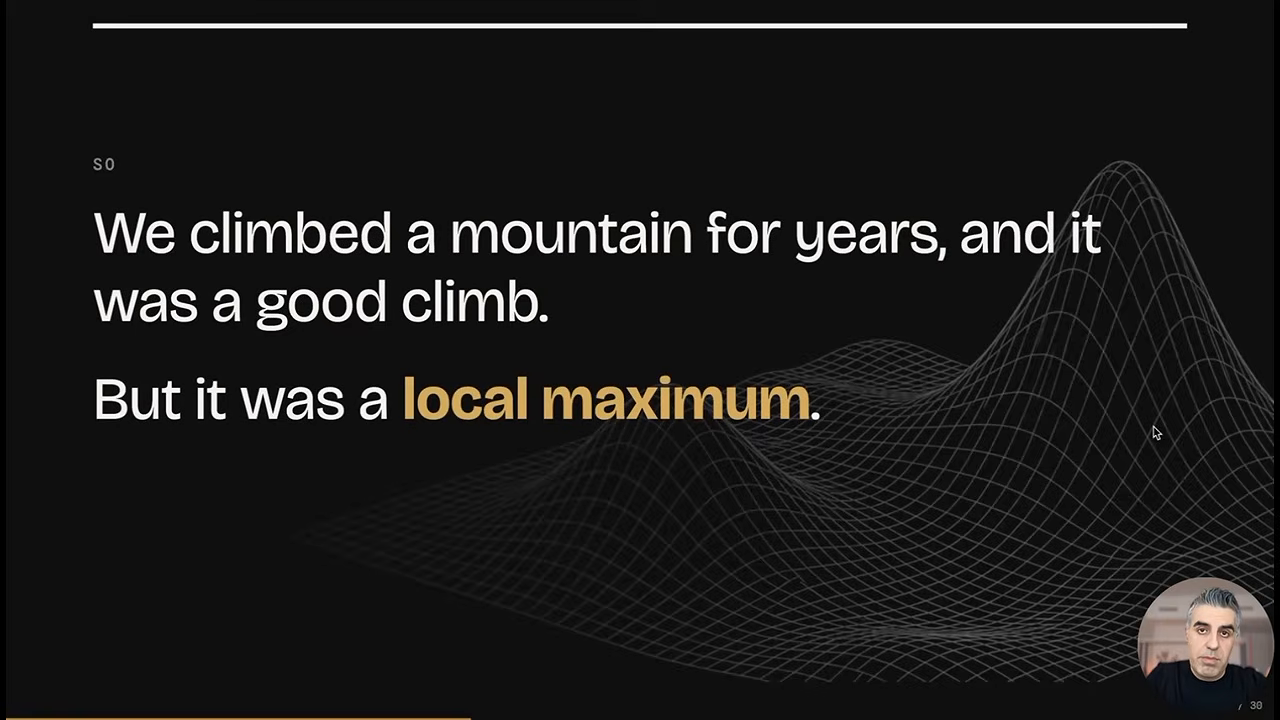
That's where the ceiling becomes real. You learn the tool. You master it. You find clever workarounds. And then you realize you've climbed a local maximum, there are bigger mountains, but this path doesn't lead there.
The Workaround Years: Building Products on Top of Limitations
Siavash and his team spent years building tools to patch the holes:
- Template Pro: Custom visualizations with HTML, CSS, and JavaScript
- Telepathy for Looker Studio: Global parameters that could write back to Sheets and BigQuery
- Triggers: Because reports couldn't trigger anything outside themselves
- Watson: A Google Analytics 4 audit tool built entirely inside Data Studio
- Moriarty: A collection of GA4 reports
And here's Siavash's honest assessment: “These were workarounds wearing product names. These were not products.”
Every tool they built existed because something was missing. They were patching limitations, not building on strengths.
With Watson specifically, the GA4 audit tool that thousands of people started using, Siavash hit the wall hard: “Nine of 10 things that I wanted to do with version 9… were not possible in Looker Studio.”
Even with Telepathy. Even with Triggers. Even with everything he knew and had built. The ceiling was still there.
The Breaking Point: When 9 of 10 Features Aren't Possible
Four years ago, Siavash would have given up on those features. “This is what the tool can do. There's no alternative. Let's just create within the tool.”
But something changed.
LLMs can now read API documentation and write client applications. They can connect to data transfer tools like Supermetrics. They can fetch, model, process, calculate, analyze, and visualize data interactively.
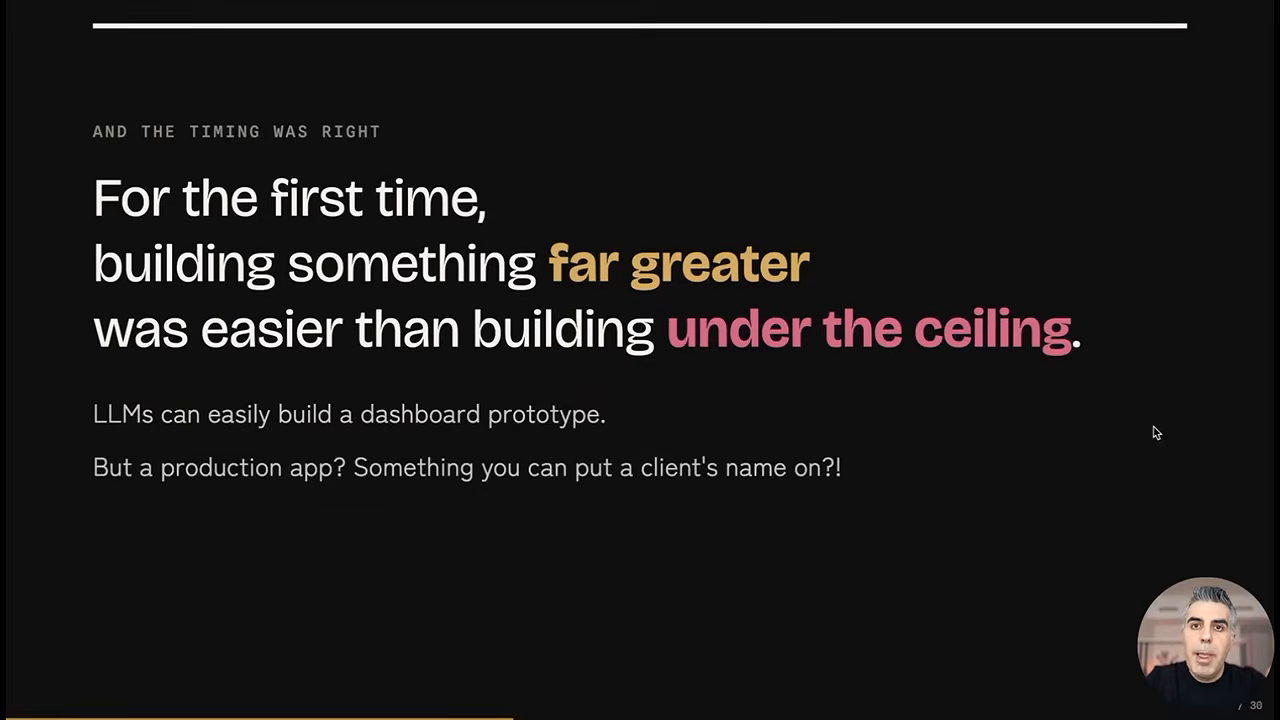
Siavash put it this way: “For the first time ever, building something much greater was easier than building under that ceiling.”
So he rebuilt Watson from scratch as a SaaS application. Weeks to get a prototype. A few more weeks to reach MVP. And here's what changed:
The old Watson (Data Studio):
- Subject to all the platform limitations
- Couldn't do the 9 features Siavash wanted
- Stuck at version 8
The new Watson (custom app):
- Connects directly to GA4 API
- Performs deeper analysis
- Root cause analysis
- AI-powered summaries
- 50x more features than the Data Studio version could ever have
The ceiling was gone. What was left? Vision, clarity on what he wanted, and ambition to try.
The Boring 80%: What It Actually Takes to Go Production
Here's the part nobody on LinkedIn talks about.
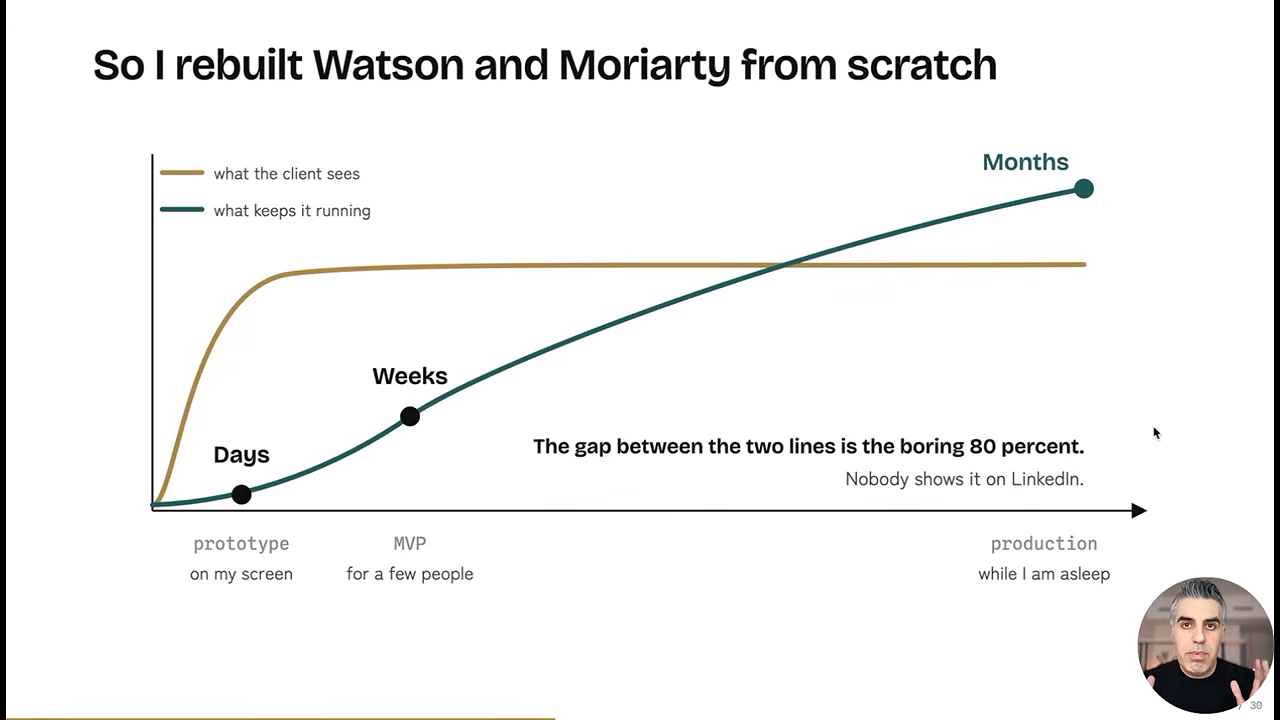
Everyone's sharing prototypes. “Built this dashboard with Claude in 10 minutes!” And yeah, you probably can get a working prototype in days.
But Siavash spent months getting from MVP to production. That's the gap. That's the “boring 80%.”
What does production actually require?
Decisions That Are Yours (Not the LLM's)
- Interactivity design: What should the viewer be able to do?
- Data fetching strategy: Live from API? Cached in BigQuery? Stored in your own database?
- User authentication: Who sees what data? How do they log in?
- Data residency: Where does the data live? (GDPR/HIPAA implications)
- Privacy and compliance: Your clients' legal requirements
Technical Infrastructure You Need to Handle
- Staging vs. production environments: Where do you safely test?
- Server uptime and monitoring: Does it work when you're asleep?
- Security: Are you exposing anything you shouldn't?
- Testing regimens: How do you prevent new features from breaking old ones?
- Schema migration: How do you update the database without breaking everything?
- Alerting: How do you know when something goes wrong at 2 AM?
Siavash's advice: “Every item on that list can be learned. I learned. I worked around them. And I'm not a developer at all. I can read HTML and JavaScript. I cannot write applications from scratch.”
The point isn't that it's easy. The point is that it's possible, and with less effort than building something inferior under a ceiling.
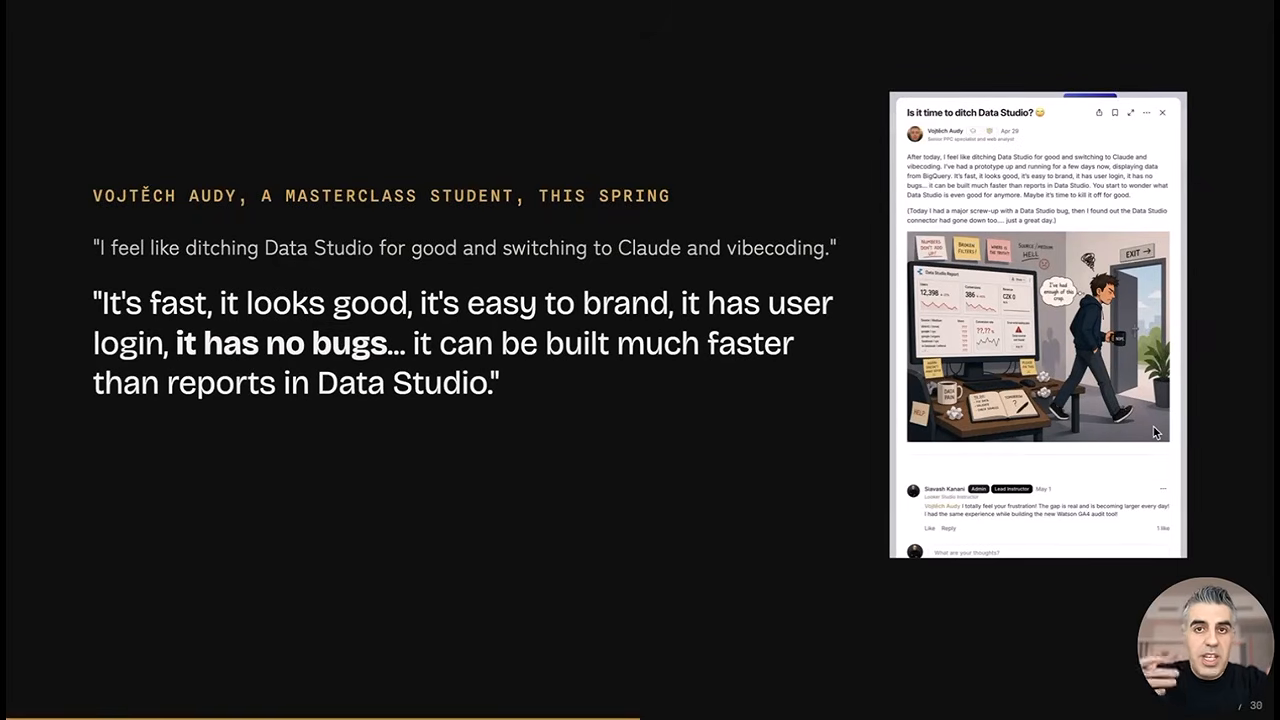
One of his masterclass students, Vojtech Audy, posted in the community: “I feel like ditching Data Studio for good.” He'd spent less than two days with Claude, connected it to BigQuery, and built something he described as “fast, looks good, easy to brand, has user login, no bugs, and can be built much faster than reports in Data Studio.”
What You Can Build Without the Ceiling
So what does “no ceiling” actually look like? Here's what Siavash demonstrated:
Custom Client Reports (Rebuilt from Data Studio)
Features that were “not possible” suddenly became standard:
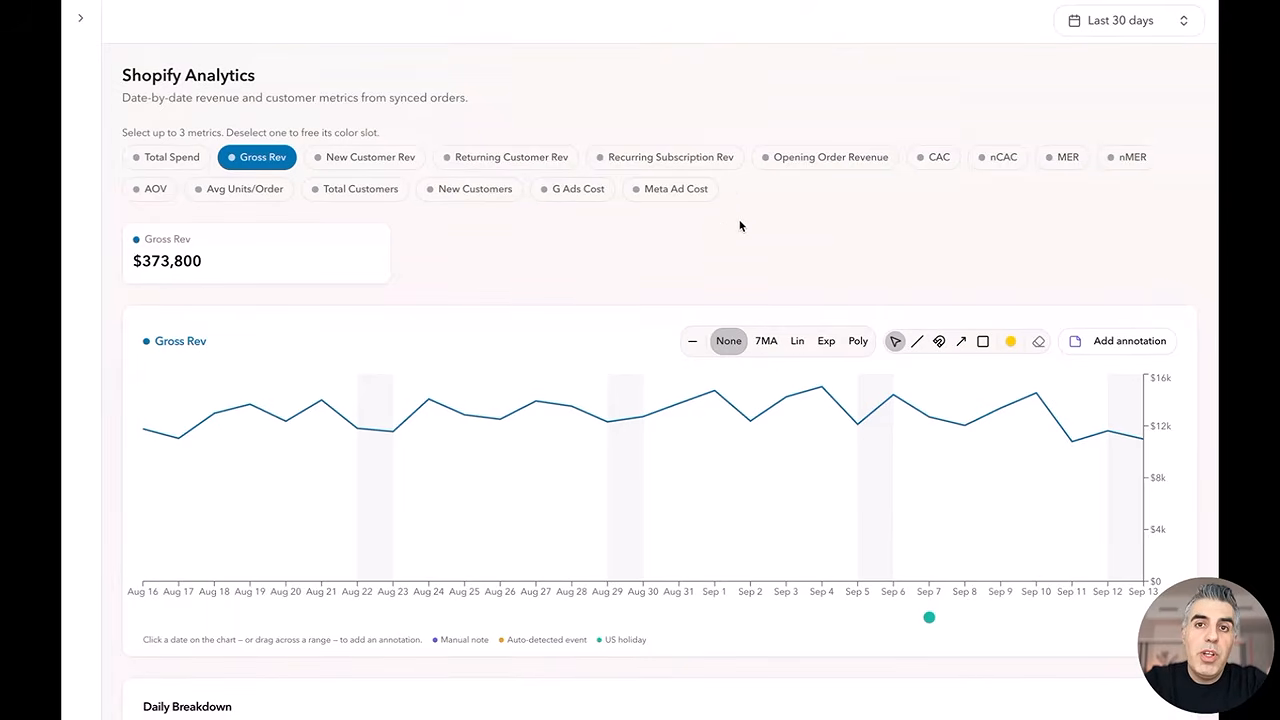
- Comparison date ranges: Viewers can change their own comparison period
- Moving averages and polynomial trends: Not limited to built-in chart types
- Dynamic coloring: Applied to KPIs, charts, and tooltips based on the data
- Annotation tools: Clients can add notes like “we ran a campaign here”
- Custom tooltips: Exactly what the client wanted, not what the tool allowed
Watson Rebuilt as Analytics Detective
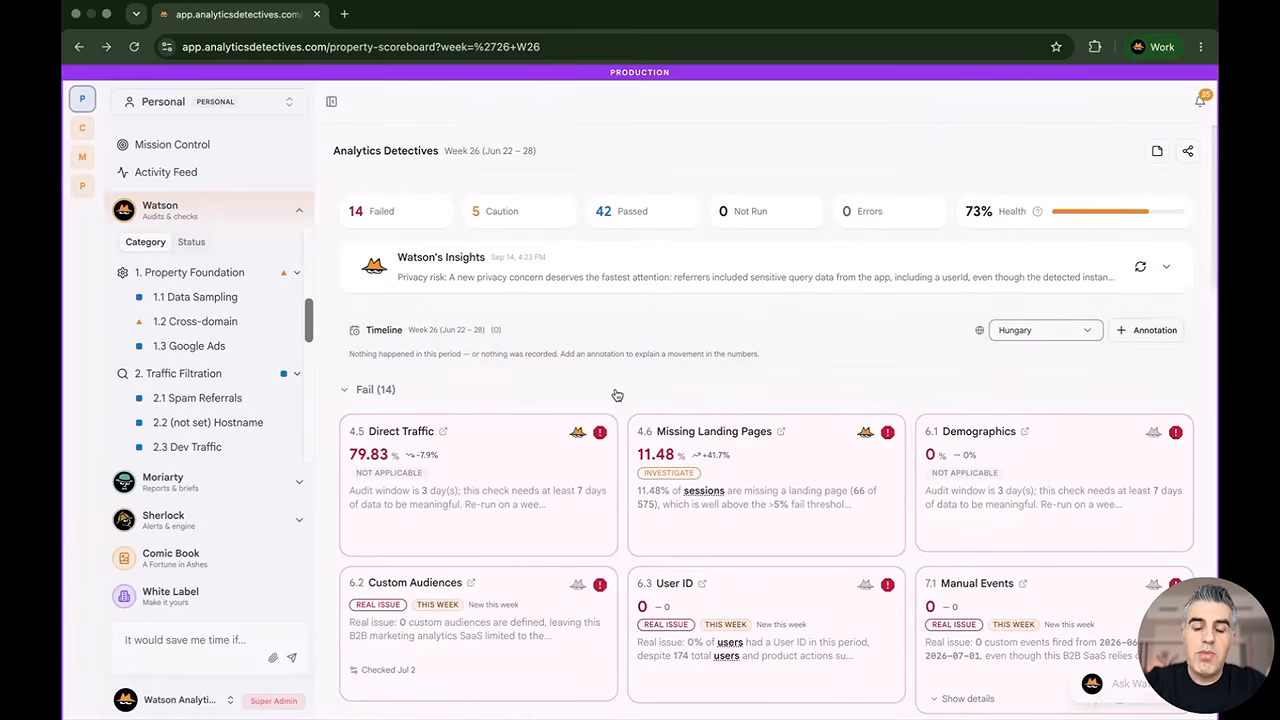
The GA4 audit tool now connects directly to GA4 data through the API, performs deeper analysis, finds root causes, and provides AI-powered summaries. It's free to start, you can try it at analyticsdetective.com.
Adaptive Reporting (Same Data, Different Views)
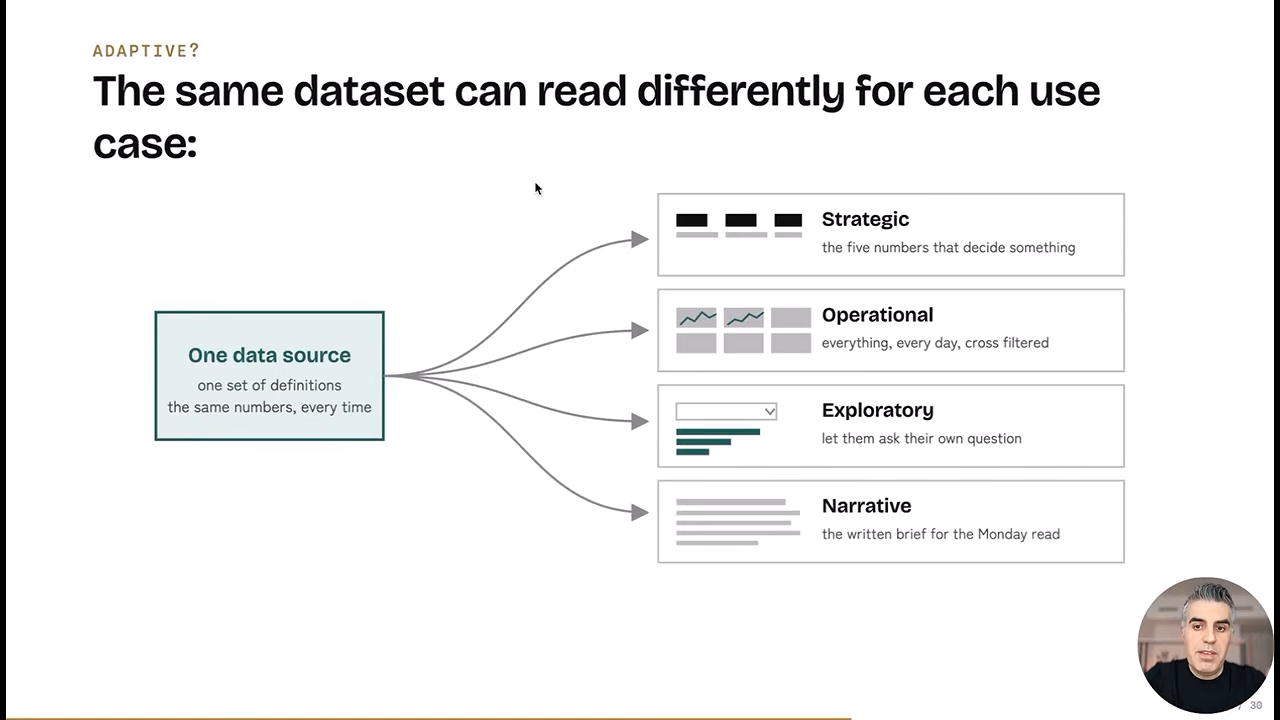
This is the concept Siavash is most excited about. Same dataset. Same metric definitions. Same calculations. But presented differently based on who's looking:
- Strategic view: Just the 5 numbers an executive needs to decide
- Operations view: Full tables, all the details
- Exploration view: Interactive drill-down capabilities
- Narrative view: A Monday morning summary
And the section titles? They regenerate dynamically based on cross-filtering. Filter by United Kingdom, then by desktop devices, and every section title updates to reflect exactly what you're looking at.
That's not possible in Data Studio. And it probably never will be.
Branded Client Reporting Hubs
Imagine your clients logging into a hub branded as your agency. They see all their reports with AI-generated summaries. They can click any metric to see its definition. They can ask follow-up questions from AI. They can comment and mention your team. They can share, export, and explore, all within something you own.
Should You Make the Switch?
Let me be realistic here. Siavash explicitly addressed whether he considered PowerBI or Tableau:
“No. Because I knew there was a learning curve for those tools… I didn't want to learn where the buttons are in another tool where 5% of the features are what I actually need. That 5%, I can build myself.”
But this path isn't for everyone. Here are the honest trade-offs:
This makes sense if:
- You're hitting Data Studio's limitations repeatedly
- Clients are asking for features you keep saying “that's not possible” to
- You're willing to invest months (not days) in production readiness
- You want to own the asset and the roadmap
This might not be for you if:
- Data Studio does everything you need
- You're not comfortable learning technical concepts (even with AI assistance)
- You need something working tomorrow, not in 3 months
- You don't want to maintain your own infrastructure
Where to Start
If you're considering this path:
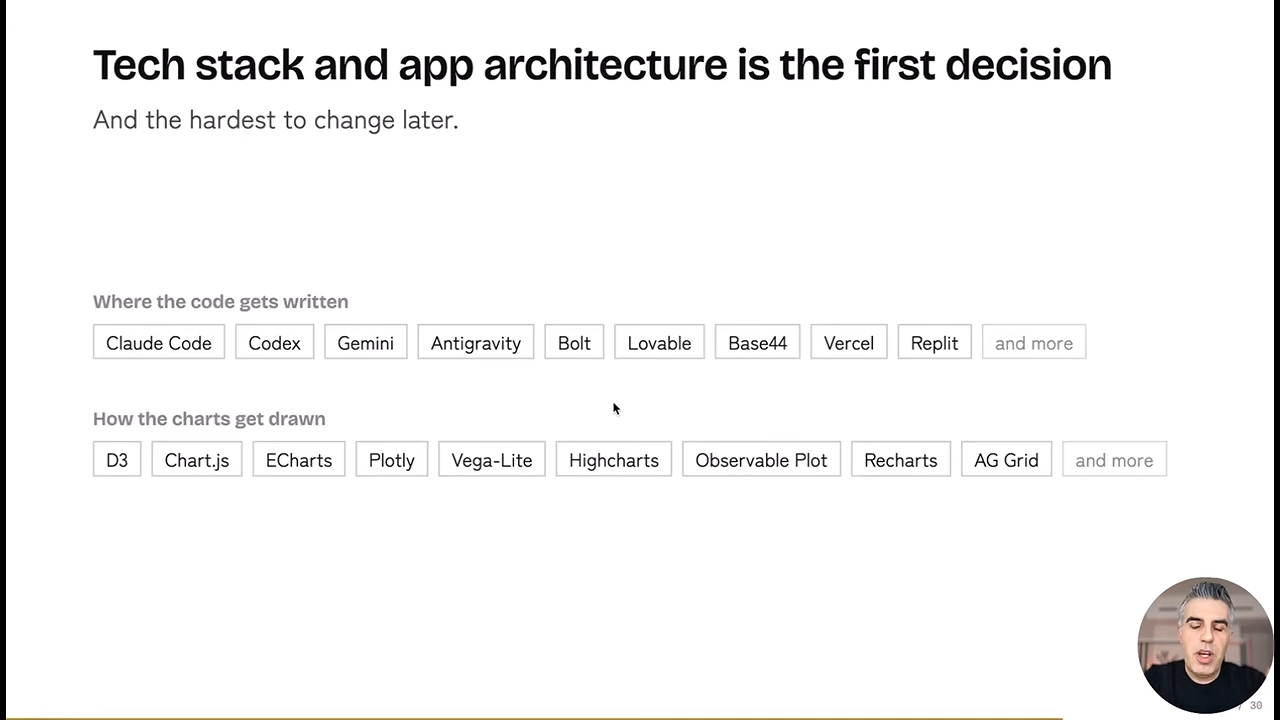
- Decide your technical level: How comfortable are you? This determines whether you use something like Cursor/Claude Code, or a managed platform like Bolt, Lovable, or Replit
- Choose your visualization library: Don't reinvent the wheel. Pick something customizable and fast
- Start with the viewer: What does your client actually need? (You can finally start here instead of starting with tool limitations)
- Document your metrics centrally: You do NOT want LLMs deciding how a KPI is calculated on every refresh
- Keep a decisions document: Each AI session is new. It needs to know why you built things a certain way
Ready to See What's Possible?
Siavash's GA4 audit tool is free to try. Go to analyticsdetective.com and run an audit on your own GA4 property. It's a good way to see what “no ceiling” actually looks like in practice.
And if you're already on this journey, building custom reporting apps with AI assistance, I'd love to hear how it's going. What's been harder than expected? What surprised you? Drop a comment below.
The ceiling's gone. What will you build?
Where MeasureU Fits
If you want the measurement side of this handled properly before you build anything on top of it, that is what we work on inside MeasureU Pro: the tracking, the definitions and the reviews that keep a dashboard worth trusting.