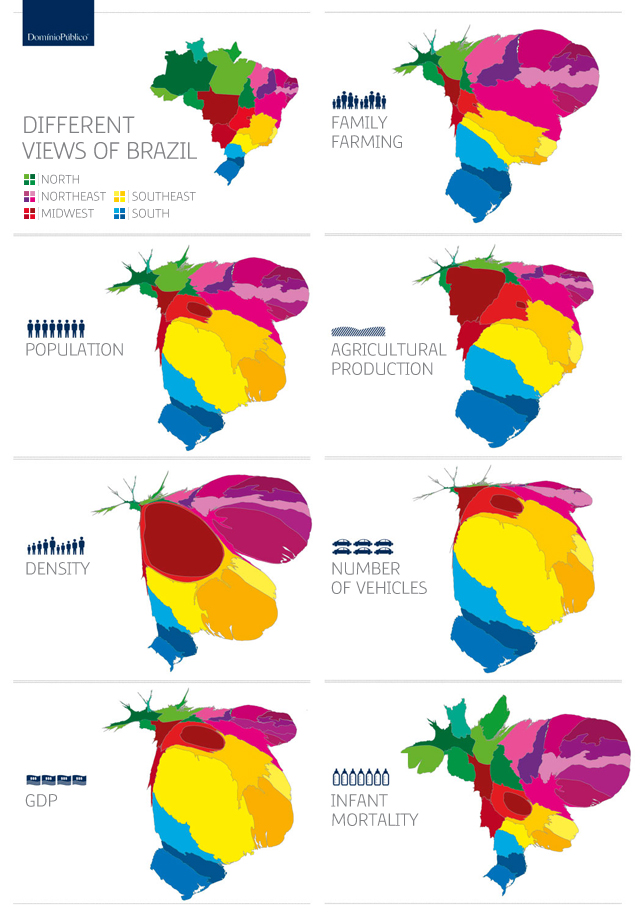
Inspired by the images published at WorldMapper.org, I decided to create an image that would represent the socio-economical differences between the Brazilian regions for a job at Domíno Público. The country is divided in five areas: North, Northeast, Midwest, Southeast and South; each with very specific characteristics (as can be seen in the infographic below).
Initially, I tried to do the illustrations manually, using Adobe Illustrator. Soon I realized that the result would be far from satisfactory. I realized that I had to figure out a way to apply the same technique used at World Mapper. After researching the subject thoroughly I found a software available that delivered the same result: Scape Toad. But to process the file inside the program I would need a map of Brazil in the shapefile format. Again, the internet helped, and I found the file ready to use and edit. Data was collected from de 2010 Brazilian Census done by IBGE. Finally I edited the colours at Illustrator to make the differences between the regions clearer.
The final result is here: