Hold on just a moment before you upload that report into ChatGPT or Claude.
We have all heard “garbage in, garbage out.” And here is the thing: AI makes this problem worse, not better. If your data is messy or unfocused, AI will confidently give you useless insights dressed up in professional language. It cannot clean your data. It cannot fix your tracking. It just amplifies whatever you feed it.
So how do you make data-driven decisions with AI when your dashboards are full of, well, everything?
That is where Q.I.A. comes in. It is a strategy we have been teaching for over a decade that keeps the garbage out of your reports before AI (or you) ever tries to analyze them.
Watch the Full Breakdown
In the video we walk through the framework end to end and apply it to two real examples: a sales page and a content marketing video.
What follows is the written version, including how to decide what belongs in your dashboard and what to cut.
What You'll Learn in This Post
- AI cannot fix or clean bad data. If your input is garbage, your output will be too
- The Q.I.A. framework (Questions, Information, Action) filters your data before analysis
- If a metric does not lead to action, it does not belong in your dashboard
- You do not need perfection to start. Phase your implementation and build as you go
Table of Contents
- What Is the Q.I.A. Framework?
- Q.I.A. in Action: Sales Page Example
- Q.I.A. for Content Marketers
- Dashboard Optimization: Only Actionable Data Allowed
- Getting Started: The Phased Approach
- Your Next Steps
What Is the Q.I.A. Framework?
Q.I.A. stands for Questions, Information, and Action. Simple, but most people skip it entirely and wonder why their dashboards do not help them make decisions.
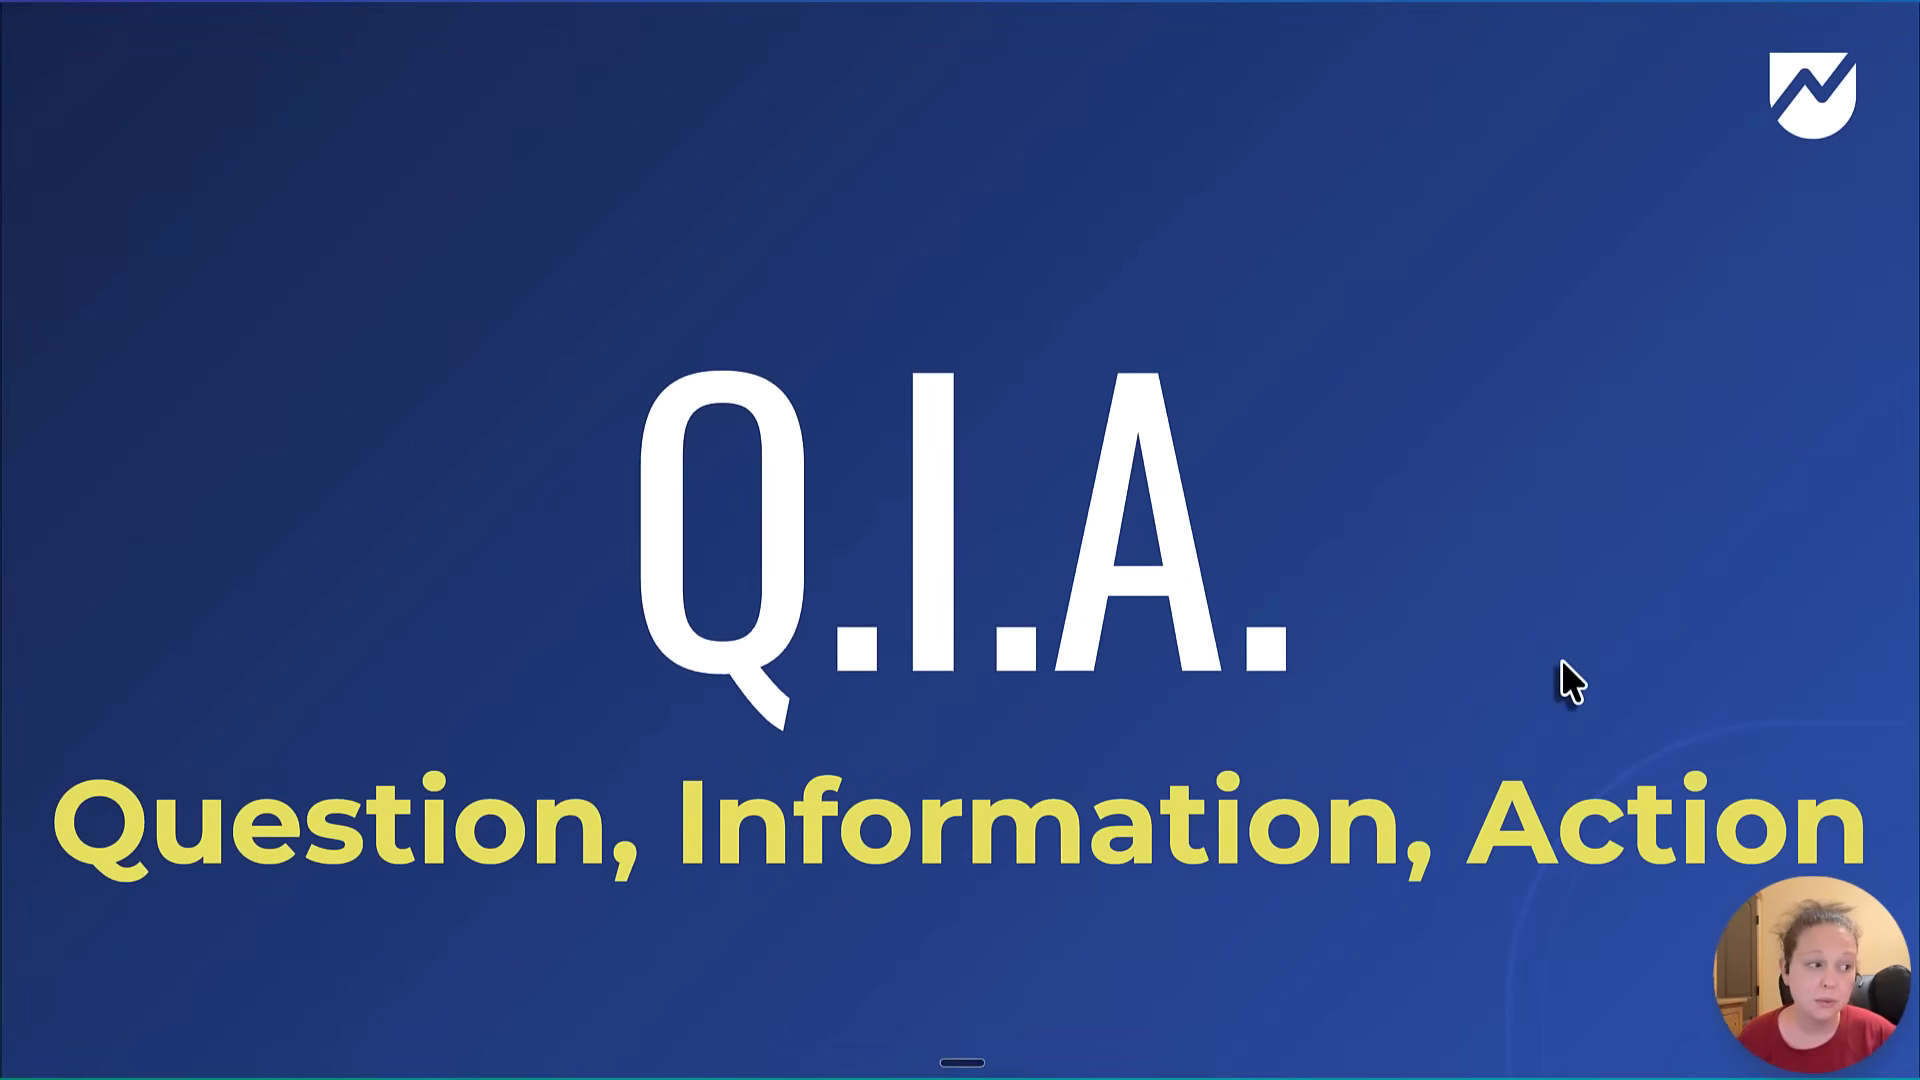
Q = Questions
Start here. What questions do you actually need your dashboard to answer? What do you want AI to help you understand?
Write them all down. And I mean all of them. Do not worry about what is possible yet. Just get clear on what you need to know.

I = Information
Now figure out what data you need to answer those questions.
- Do you need clicks, scrolls, or page views?
- Do you need data from multiple platforms?
- Does your CRM need enhancement to understand specific details?
This is where your Google Analytics reporting setup matters. But only for the metrics that answer your questions, not everything GA4 can track.

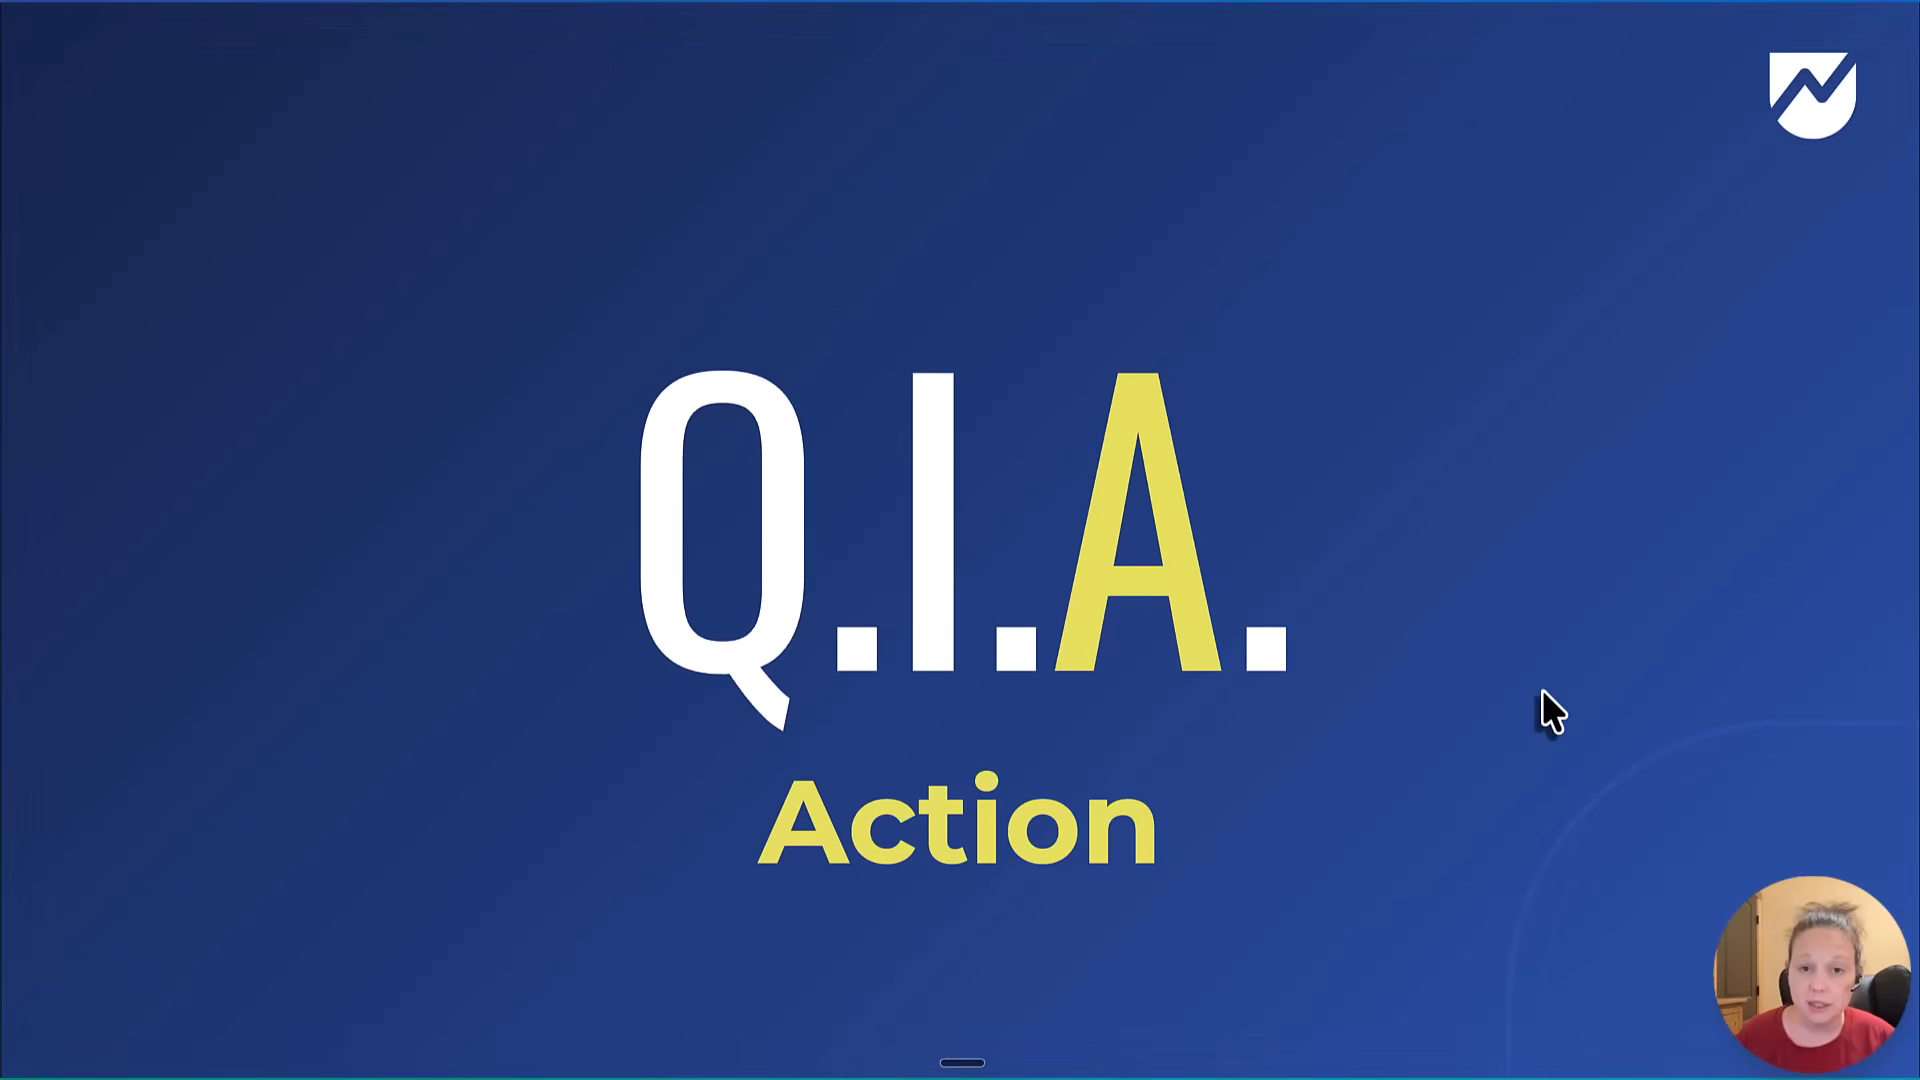
A = Action (This Is the Big One)
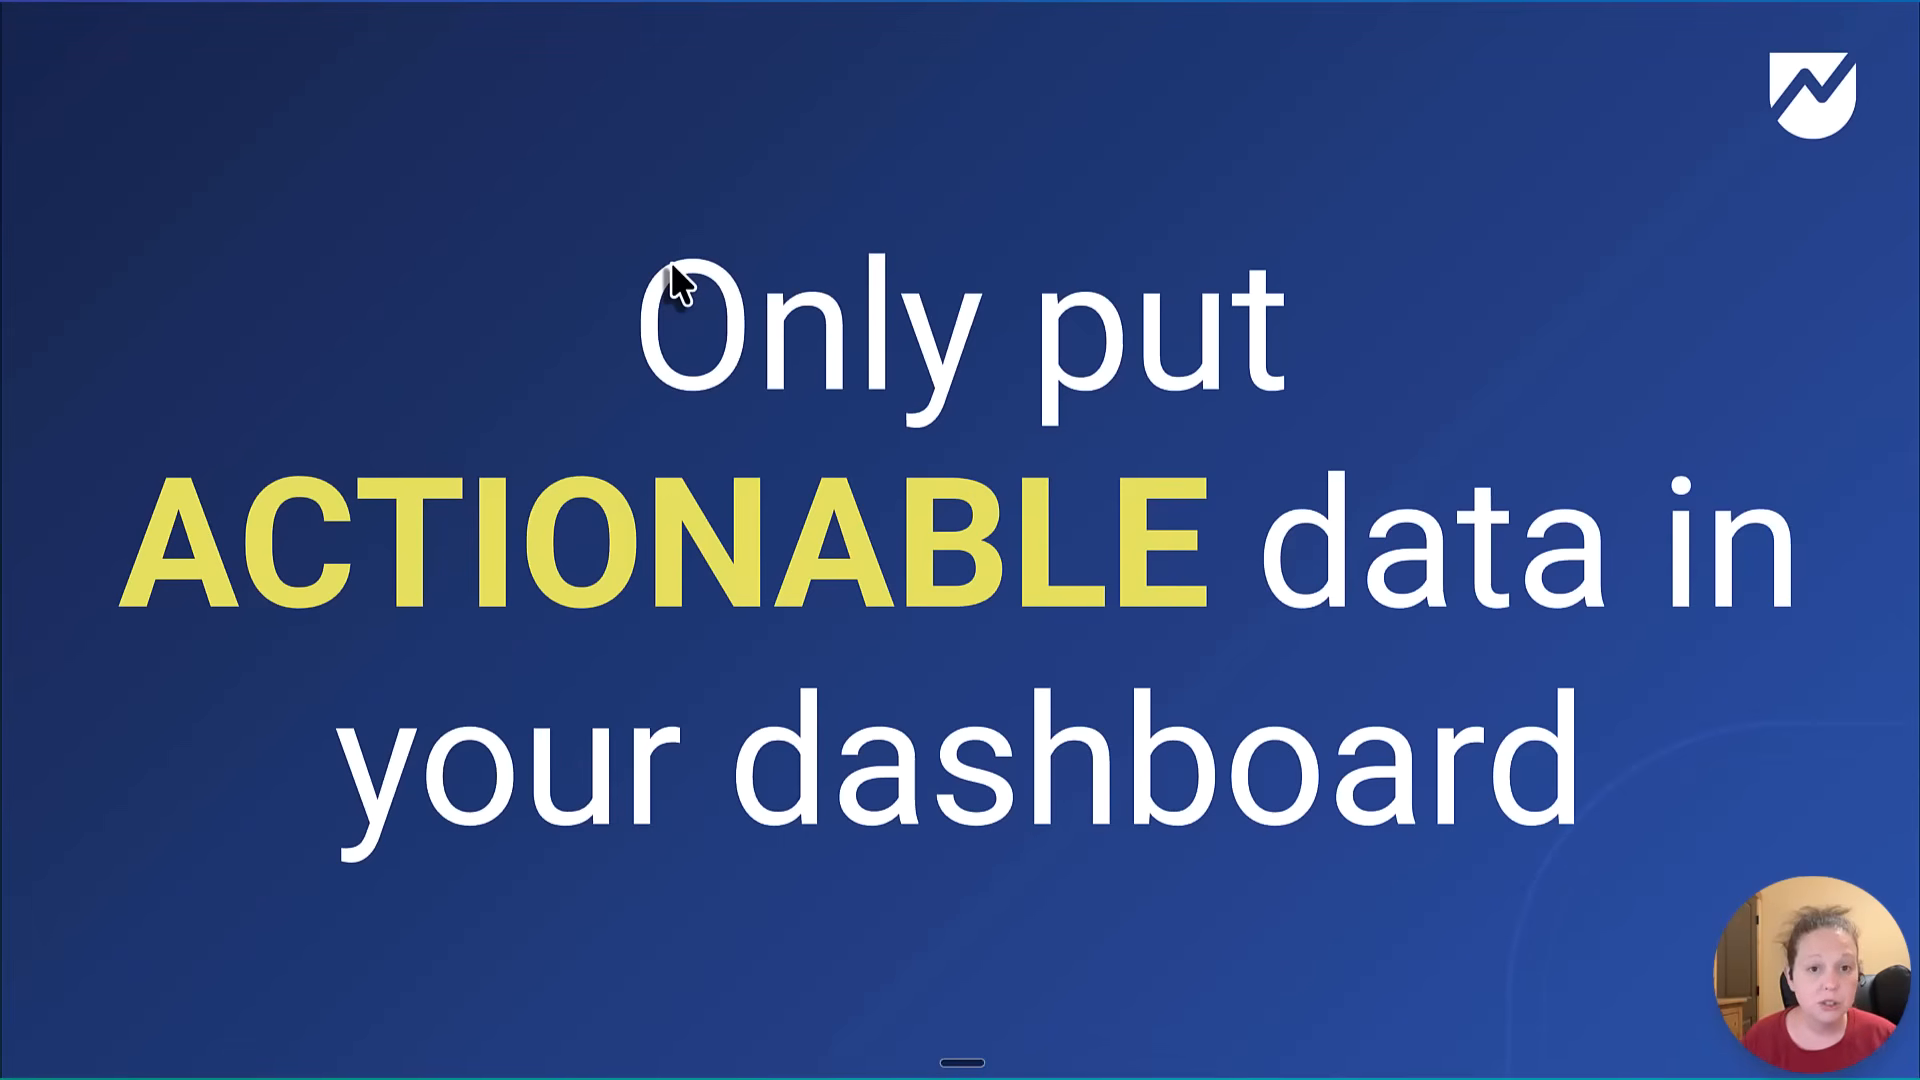
Here is the truth: if you cannot take action on a piece of data, it does not belong in your dashboard.
Otherwise you are just data hoarding. Collecting numbers because they exist, not because they help you do anything.
Every metric in your dashboard should lead to a decision. If it does not, cut it.
Q.I.A. in Action: Sales Page Example
Let us make this concrete. Say you have a typical sales page and you want to understand performance.
Question 1: How Many People Saw This Page?
Information needed: Page views
Action: If you need 1,000 people to see the page to hit your conversion target and you are below that, your action is to increase traffic. Clear, specific, actionable.
Question 2: How Many People Actually See the Offer and Engage With It?
This one is more interesting. You might ask: how many people see the offer portion and spend at least three seconds on the call to action?
Information needed: Scroll depth tracking plus time on element
Actions:
- If people are not spending time on the offer section, investigate why it is not landing. Maybe your copy needs work, maybe the offer itself is not compelling
- If they are spending time there but not converting, your action might be to increase traffic. The offer works, you just need more people seeing it
Either way, it leads to something you can actually do. Not just a number to stare at.
Q.I.A. for Content Marketers
Content marketing has its own version of this problem. You are tracking page views on blog posts but then what?
Better Question: How Many People Actually Consumed the Content?
Maybe that means: how many people stayed on a blog for more than 10 to 15 seconds? Or watched a specific video embedded in the post?
You can track this with tools like Google Tag Manager. Set up scroll triggers, video engagement events, and time-based triggers.
Taking It Further
Say your video is a precursor to a call to action on the page. Now you can ask: of the people who watched the video, how many went to the sales page or purchased?
If they did not convert: Maybe adjust the placement or timing of the video. Maybe the transition from content to offer feels abrupt.
If they did convert: Double down on that content format. Promote it harder.
See how every metric connects to something you can do?
Dashboard Optimization: Only Actionable Data Allowed
Once you have Q.I.A. as your filter, your dashboard becomes genuinely useful instead of overwhelming.
Here is a distinction that matters:
- Google Analytics 4 (your raw data): I might measure every click in GA4 for troubleshooting purposes. That is fine, it is your data warehouse.
- Your dashboard (your decision tool): This should only contain metrics that answer your questions. The ones from the very beginning of your Q.I.A. planning.
When you build dashboards this way, your build becomes much more efficient. You are not wondering “should I include this metric?” anymore. The answer is simple: does it answer one of your questions? Does it lead to an action? If not, it stays out.
Getting Started: The Phased Approach
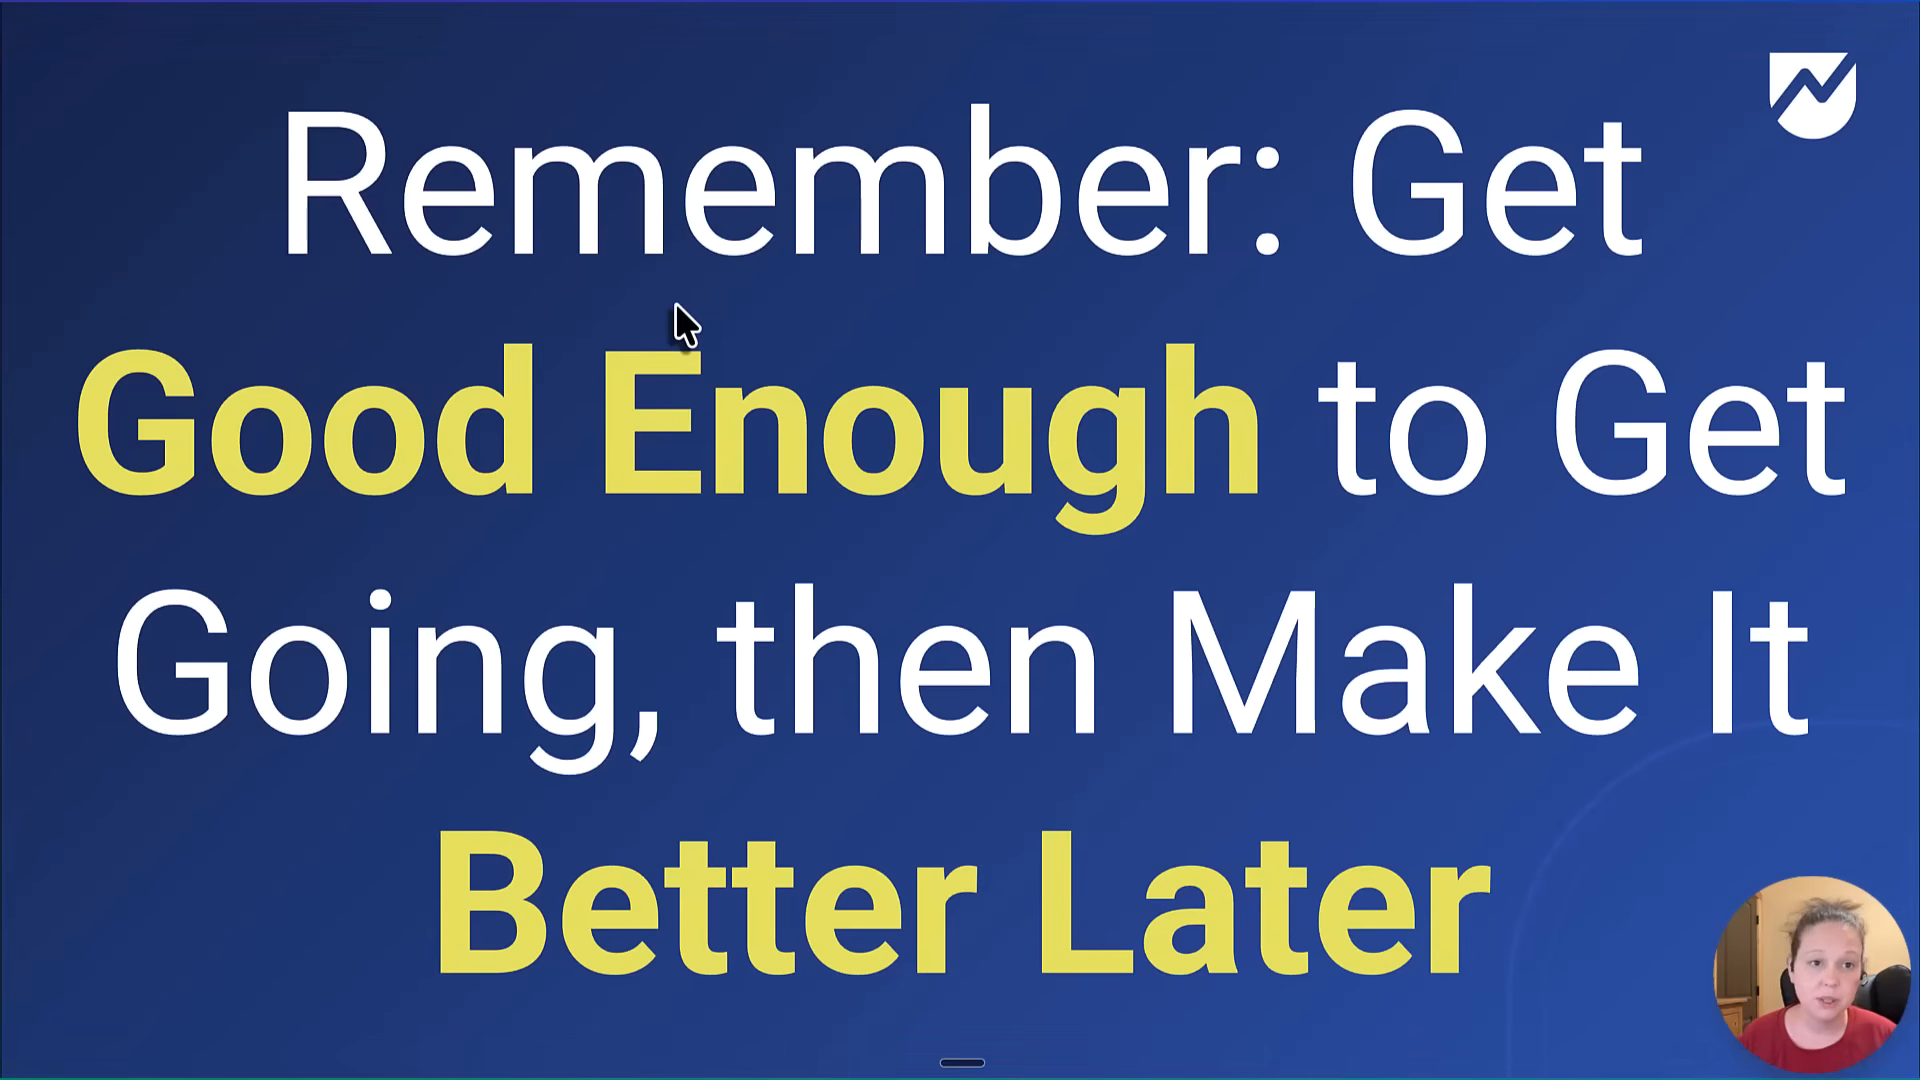
I want to be clear about something: you do not have to be amazing from the get-go. You just need to be good enough to get going.
Break your Q.I.A. planning into phases:
- Phase 1: Your 5 essential questions. The ones you need answered this week.
- Phase 2: Secondary questions that would be nice to have.
- Phase 3: The complicated questions that require custom tracking or multiple data sources.
Get started with phase one. Take action on what you learn. Then build from there.
I have watched people spend months planning the perfect dashboard and never actually launch it. Do not be that person. Start messy, optimize as you go.
Your Next Steps
- Write down your top 5 questions about your marketing or business data
- Identify what information you need to answer each one
- Check each metric: can you take action based on this data?
- If yes, it goes in the dashboard. If no, it does not.
- Build phase one and start using it immediately
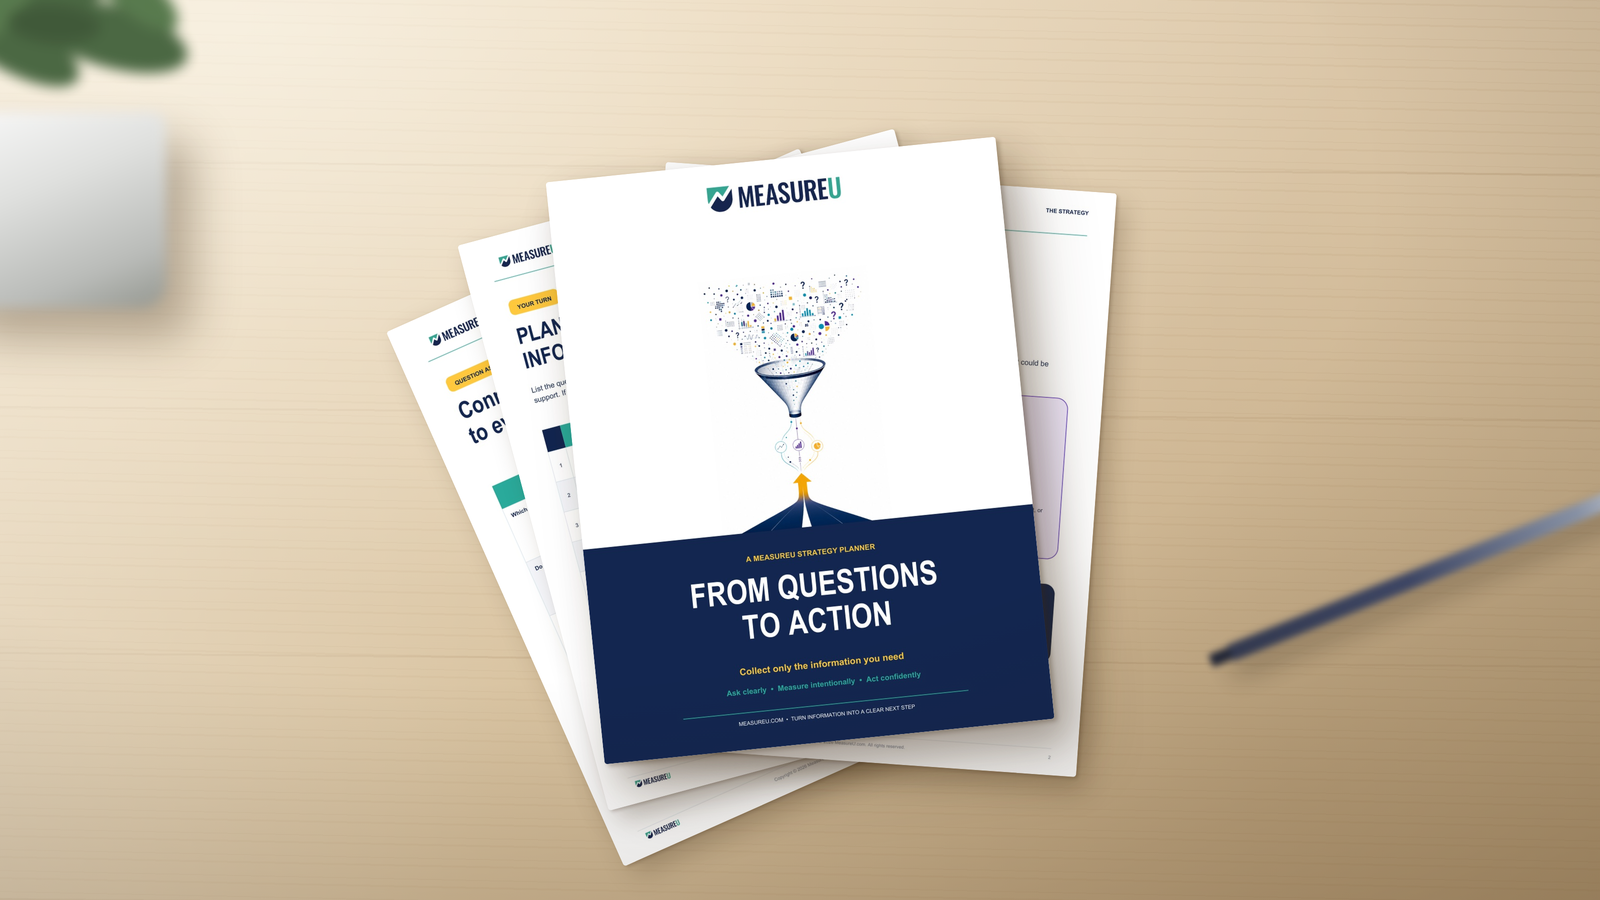
Ready to start your own Q.I.A. planning? Download the free From Questions to Action Planner and walk through the entire framework step by step.
And if you want the whole clean-data system behind it, with the training and support to implement it on client accounts, check out MeasureU Pro.