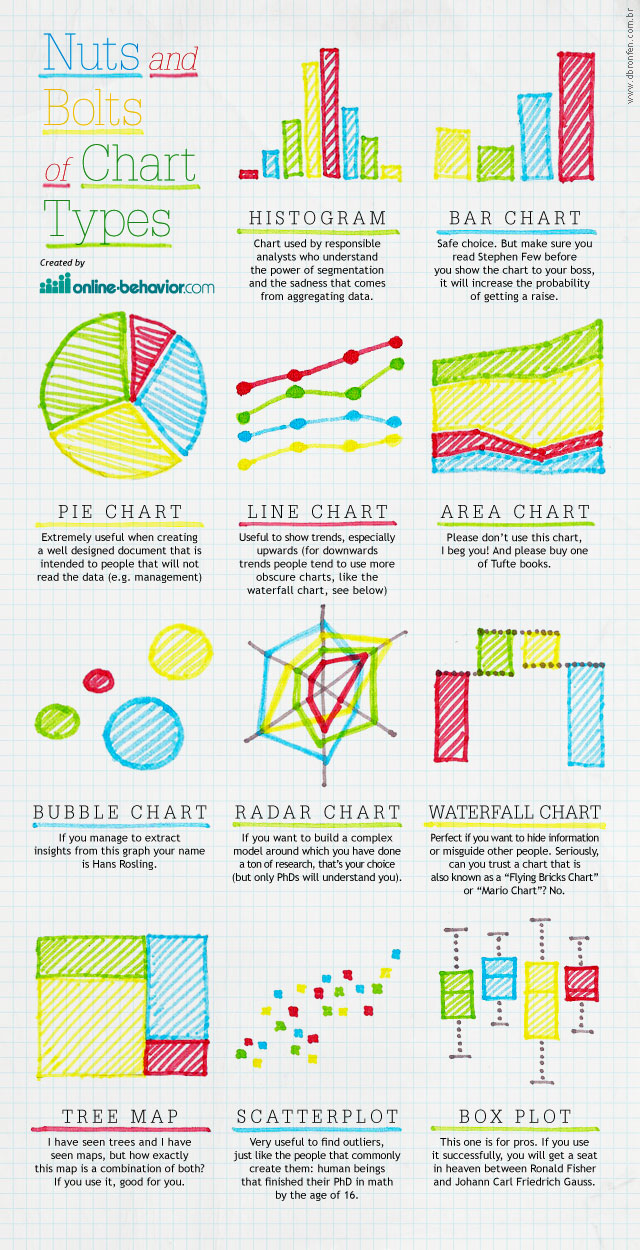
The infographic below provides a quick list of the types of charts that are available for analysts/marketers out there. I do not intend to provide a comprehensive list, neither an accurate explanation of each (you will note!) But I do provide a 'tell me which graphs you use and I will tell you who you are' cheat sheet where I describe some of the personality types of people using different charts. Disclosure: I am aware that any chart can be used in a responsible way, and that every graph has its advantages and disadvantages, but I think there is a rule of thumb of which are good charts and which are not-so-good. The figure was written by me and designed by Daniel Bronfen, who has contributed another infographic to Online Behavior: Data Visualization: Social-Economical Differences in Brazil.
Chart & Graph Types Infographic
Additional Resources
For tips and tricks on Chart and Information design, I warmly recommend the books below (which I also quote in the infographic):